A video version of this blog post is now available here:
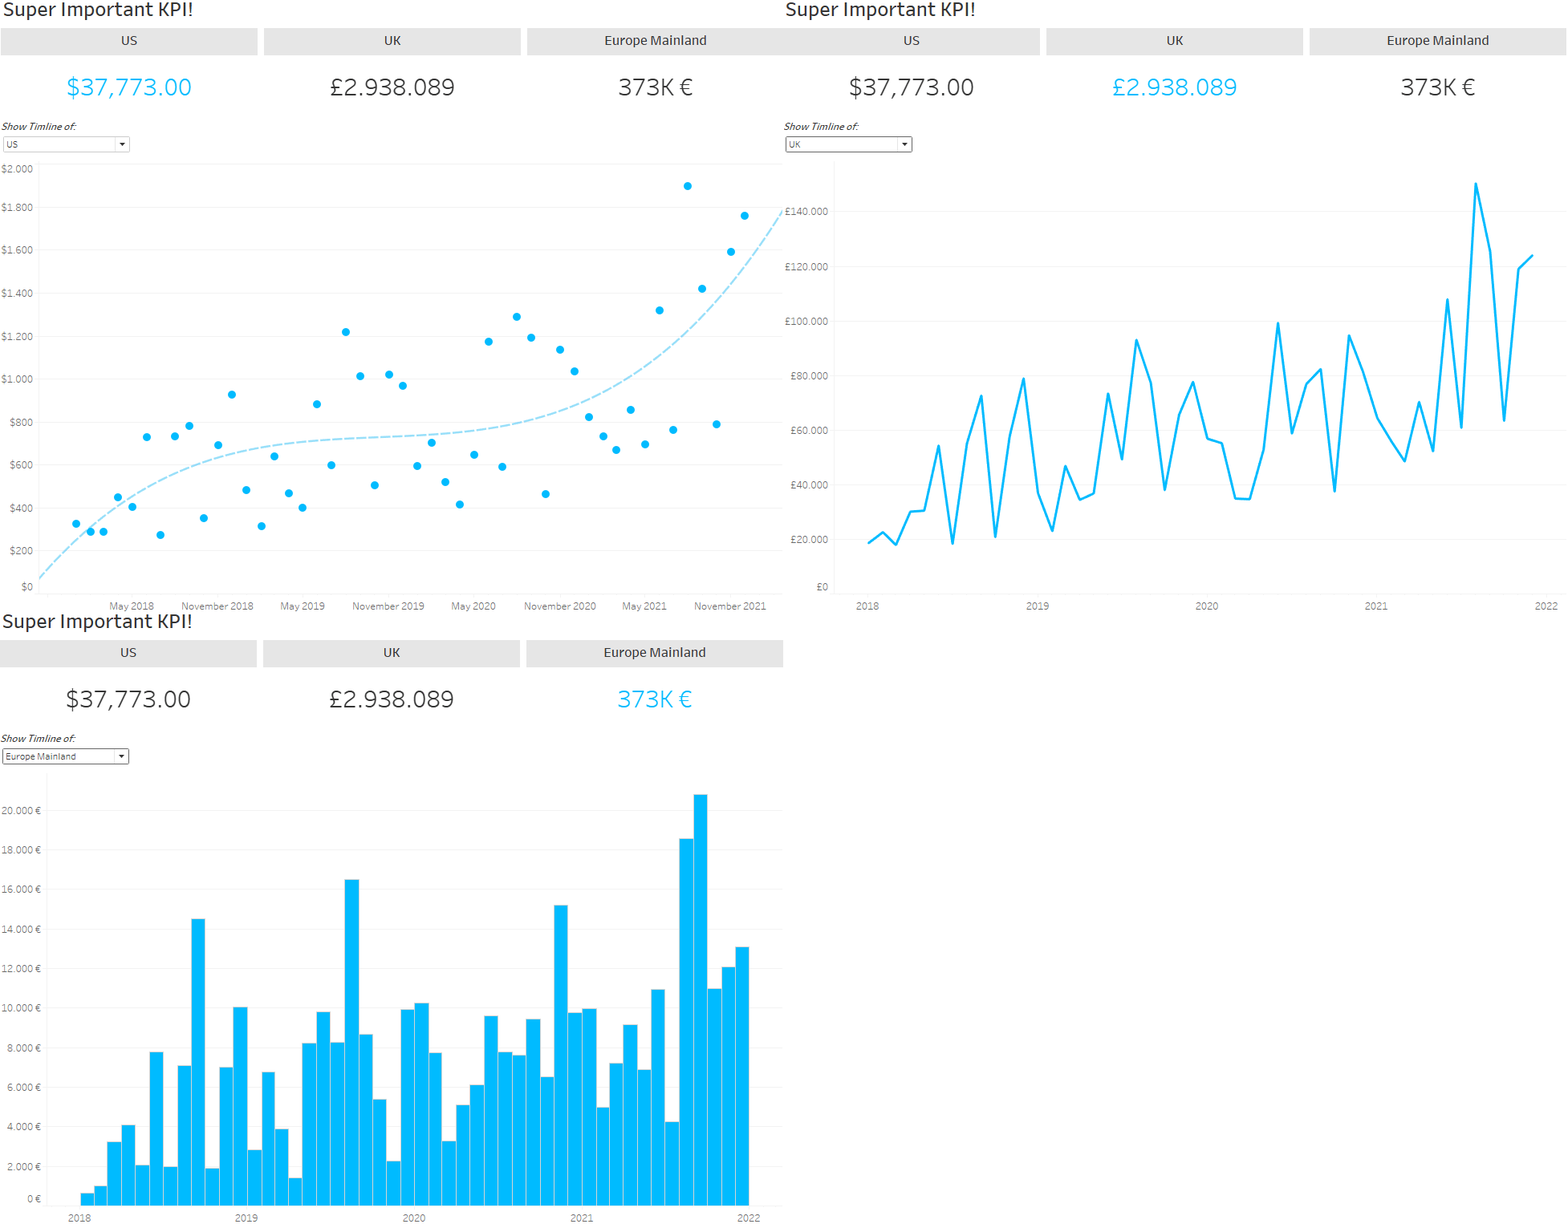
This article may be a little bit late to the party, but hey, better late than never. It seems we have so many articles explaining how to leverage sheet swapping, sharing certain specifics that have changed and reviewing when new Tableau versions came to be that we skipped over the foundational piece! So, let’s keep this brief and short: what is sheet swapping? This:

The Challenge
We’ve built a dashboard and want to add more interactivity. Let’s say we have three different KPIs and want to examine their timelines. But we have limited space, as there is not much real estate on a dashboard – either because there aren’t enough pixels (especially when viewing on a tablet) or because there is already too much going on. And as we know, overly busy dashboards are difficult to consume.
So, what to do? We want the user to see one chart at a time, not more. Now, you may think, Just build a measure swap, right? Create a calculated field, and put a CASE statement in there that checks a parameter and gives us one of three measures. Absolutely, that would be the way to go. Unfortunately, we don’t want only the numbers to change but also the chart type. We switch, and the line chart for one KPI should become a bar chart for the other KPI.
Enter sheet swapping!
How Sheet Swapping Works
The steps are pretty simple. Short version:
- Create a parameter.
- Put that parameter into a calculated field.
- Put that calculated field onto Filter in the swapping sheets.
- Arrange the sheets in a dashboard container.
Now, here is the long version.
By the way: Since version 2022.3, there has been another cool solution for this challenge, leveraging Tableau’s Dynamic Zones, if you want to check it out.
Create a Parameter
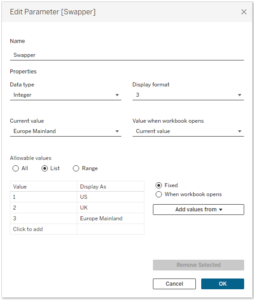
Ideally, this will be an integer, but it also works with Boolean data types – when we have only two sheets we want to swap – and, of course, with strings. Make the allowed values a list of as many values as you have sheets to swap. (If you use integer or Boolean, make sure to assign aliases; otherwise, we might expect a bit too much from our user.)

Create a Calculated Field
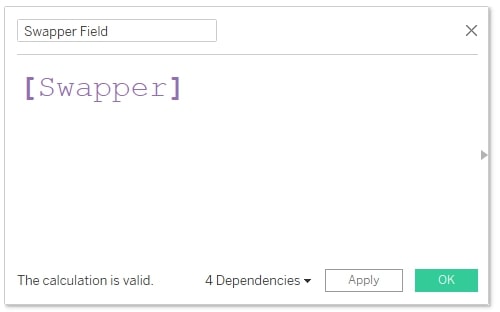
Don’t put anything else in there but the very parameter we just created! Make sure the field is a dimension, not a measure:

Filter Your Sheets
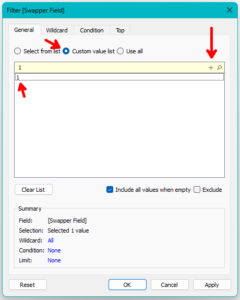
Set the parameter to your first option. Drag the [Swapper Field] onto Filter on your first swapping sheet. Don’t make the filter be applied to all sheets; that won’t work. Each sheet will have its own filter:

Set the parameter to the second option, and repeat the process for your second sheet and so on.
Arrange the Swapping Sheets in a Container & Remove Titles
Create a vertical or horizontal container on your dashboard. Make sure it does not distribute its elements evenly (default setting). Drag your swapping sheets into this container. Remove the sheet titles because it won’t work when they are still there.
Perfect! Don’t forget to either show your parameter (otherwise no one can use it) or build a parameter action to change the parameter by clicking Marks. And now: enjoy! As soon as you change the parameter, the sheets will swap places. Let’s summarize:
Parameter changes > value of calculated field changes > filter changes > sheets swap
What Else Can Sheet Swapping Do?
While the technique is pretty straightforward, the implications are extensive. You can swap two sheets, three sheets, ten sheets! Even a whole dashboard if you want to – all you need to do is filter all sheets of Dashboard A for parameter value 1 and all sheets of dashboard B for parameter value 2.
You can put text onto your sheet (like explanations or guidance through a dashboard) and swap that for an empty sheet, so it disappears when the user doesn’t want to see it anymore (though that has become obsolete since Tableau Desktop 2021.2 when Tableau introduced the Hide/Show Button for everything on our dashboard). You can connect the parameter to a parameter action on your dashboard and make the dashboard change appearance within the user flow by clicking on what you want to analyze.
Now, the world of displaying content depending on a parameter is open to you!


