Each year, Tableau holds several contests to find participants for the annual Iron Viz competition. The first one of 2015 is the Wiki Data Viz Contest. In the past, I’ve had trouble finding an idea, so I never entered anything. This time, I connected a few dots for inspiration:
- The challenge is to visualize any data from Wikipedia.
- Tableau’s blog post on gathering Wikipedia data links to an article comparing its importance to the pyramids.
- TC15 will be in Las Vegas, which is home to the iconic Luxor pyramid.
With all this in hand, I went straight to searching for pyramid data. Without this lead, I would still be surfing a vast pool of knowledge on every subject of interest to mankind and would miss the deadline once again.
After scraping the data with import.io, I came up with a viz that compares side profiles, shows locations, lists key attributes and links to more details on Wikipedia. Take a look:
Taking Advantage of Features in Tableau 9
Although Tableau 9 is still in beta, Tableau Public can host workbooks created in that version. There were two new features I used for this challenge that I was glad to have:
- Splitting fields
- Regular expressions
Splitting a Field
Geographic coordinates listed on Wikipedia are in degrees, minutes, seconds format. That links to a page which automatically converts to decimal form, which is listed as latitude, longitude.
While I could have split the columns in the source Excel file, that isn’t always an option with other data sources. Tableau 9 allowed me to either split it in the data source connection or with the new SPLIT() function. For example, I can get the latitude using this calculation which recognizes the comma as a separator: FLOAT(SPLIT([Site Coords],”, “,1)).
Regex
If I did not already have the values converted to decimal degrees, I could have used the regular expressions (regex) supported in Tableau 9 to extract each part of the degrees, minutes, seconds string and convert it from there. While I didn’t need to do that for the site locations, regex came in handy to parse the pyramid dimensions.
Most pyramids are square, some are rectangular and some are unfinished, leading to heights listed as ?, N.A., or (N.A.). Therefore, the formats aren’t standardized enough to make it easy to use the SPLIT() function. I used regex to get the base, length and height from messy stings like these:
- 121w.x109d.x60h.
- 120sq.x7h.
- 106.2sq.x68 !~N.Ah.
- 200sq.x(N.A)h.
- 146w.x136d.x?h.
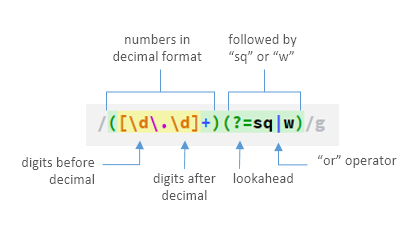
Let’s take a close look at some expressions to get base, length and height. The calculation for the base (or width) measurement looks like this:
![]()
I used RegExr to find examples and test different conditions based on the data format. I like that tool for its “cheatsheet” and highlighting, which makes convoluted code easier to follow. I have annotated the image below with some of what you’ll find in RegExr, but the best place to learn how it works is to look through the tooltips on each part here.

To pull out the length (or depth) measurement, just replace (?=sq|w) with (?=sq|d). Getting the height is just as simple, despite the existence of various ways to indicate “not applicable” for unfinished structures. Replacing (?=sq|w) with (?=h) will return the height if it exists as a number or NULL if it’s anything else.
Voting for Iron Viz
Voting for the Wiki Data Viz Contest begins March 23rd. This blog post will be updated at that time with instructions on how to vote for your favorite.

