At the heart of the American Southwest, Arizona is a state known for its natural beauty and its unique cultural history. Though it’s been a melting pot for some time, its modern-day position on the US-Mexican border combined with the geopolitical events of the past few decades has transformed it into ground zero for controversial immigration issues. That makes it the perfect place to hold the nation’s preeminent hackathon focused specifically on immigration: Migrahack.

What Is Migrahack?
Migrahack began in 2012 with Claudia Núñez, a journalist and John S. Knight Fellow at Stanford University. Nuñez noticed that women and people of color were few and far between at hackathons and that the majority of people at these events were strictly computer programmers or data types. This spurred her to think of new ways in which she could get more people involved in these events and the data world in general.
Her solution? An event that’s equal parts hackathon and journalistic forum – all centered on the polarizing issue of immigration. Thus, Migrahack was born. Phuong Ly, also a journalist and Stanford Knight Fellow, helped develop and expand Migrahack and brought the project under her organization, the Institute for Justice & Journalism (IJJ). Migrahack has been held in Los Angeles, Chicago and Mexico City.
What makes Migrahack different, aside from its focus on immigration, is that it connects journalists, students, graphic designers, programmers and data analysts from all over the world. In other words, it’s geared towards a wider audience than just those with a background in data. Journalists bring their knowledge of current events and reporting, but many lack technical data analysis skill or are unaware of the possibilities technology presents. On the other hand, techies and data analysts have technical skills in spades but are often unaware of how those skills could be applied to current issues, specifically those surrounding immigration.
Together, these diverse groups use the power of data visualization to tell stories driven by data. It’s an unexpected collaboration that, when you think about it, makes a lot of sense. And this collaboration was on full display at Arizona Migrahack this year.
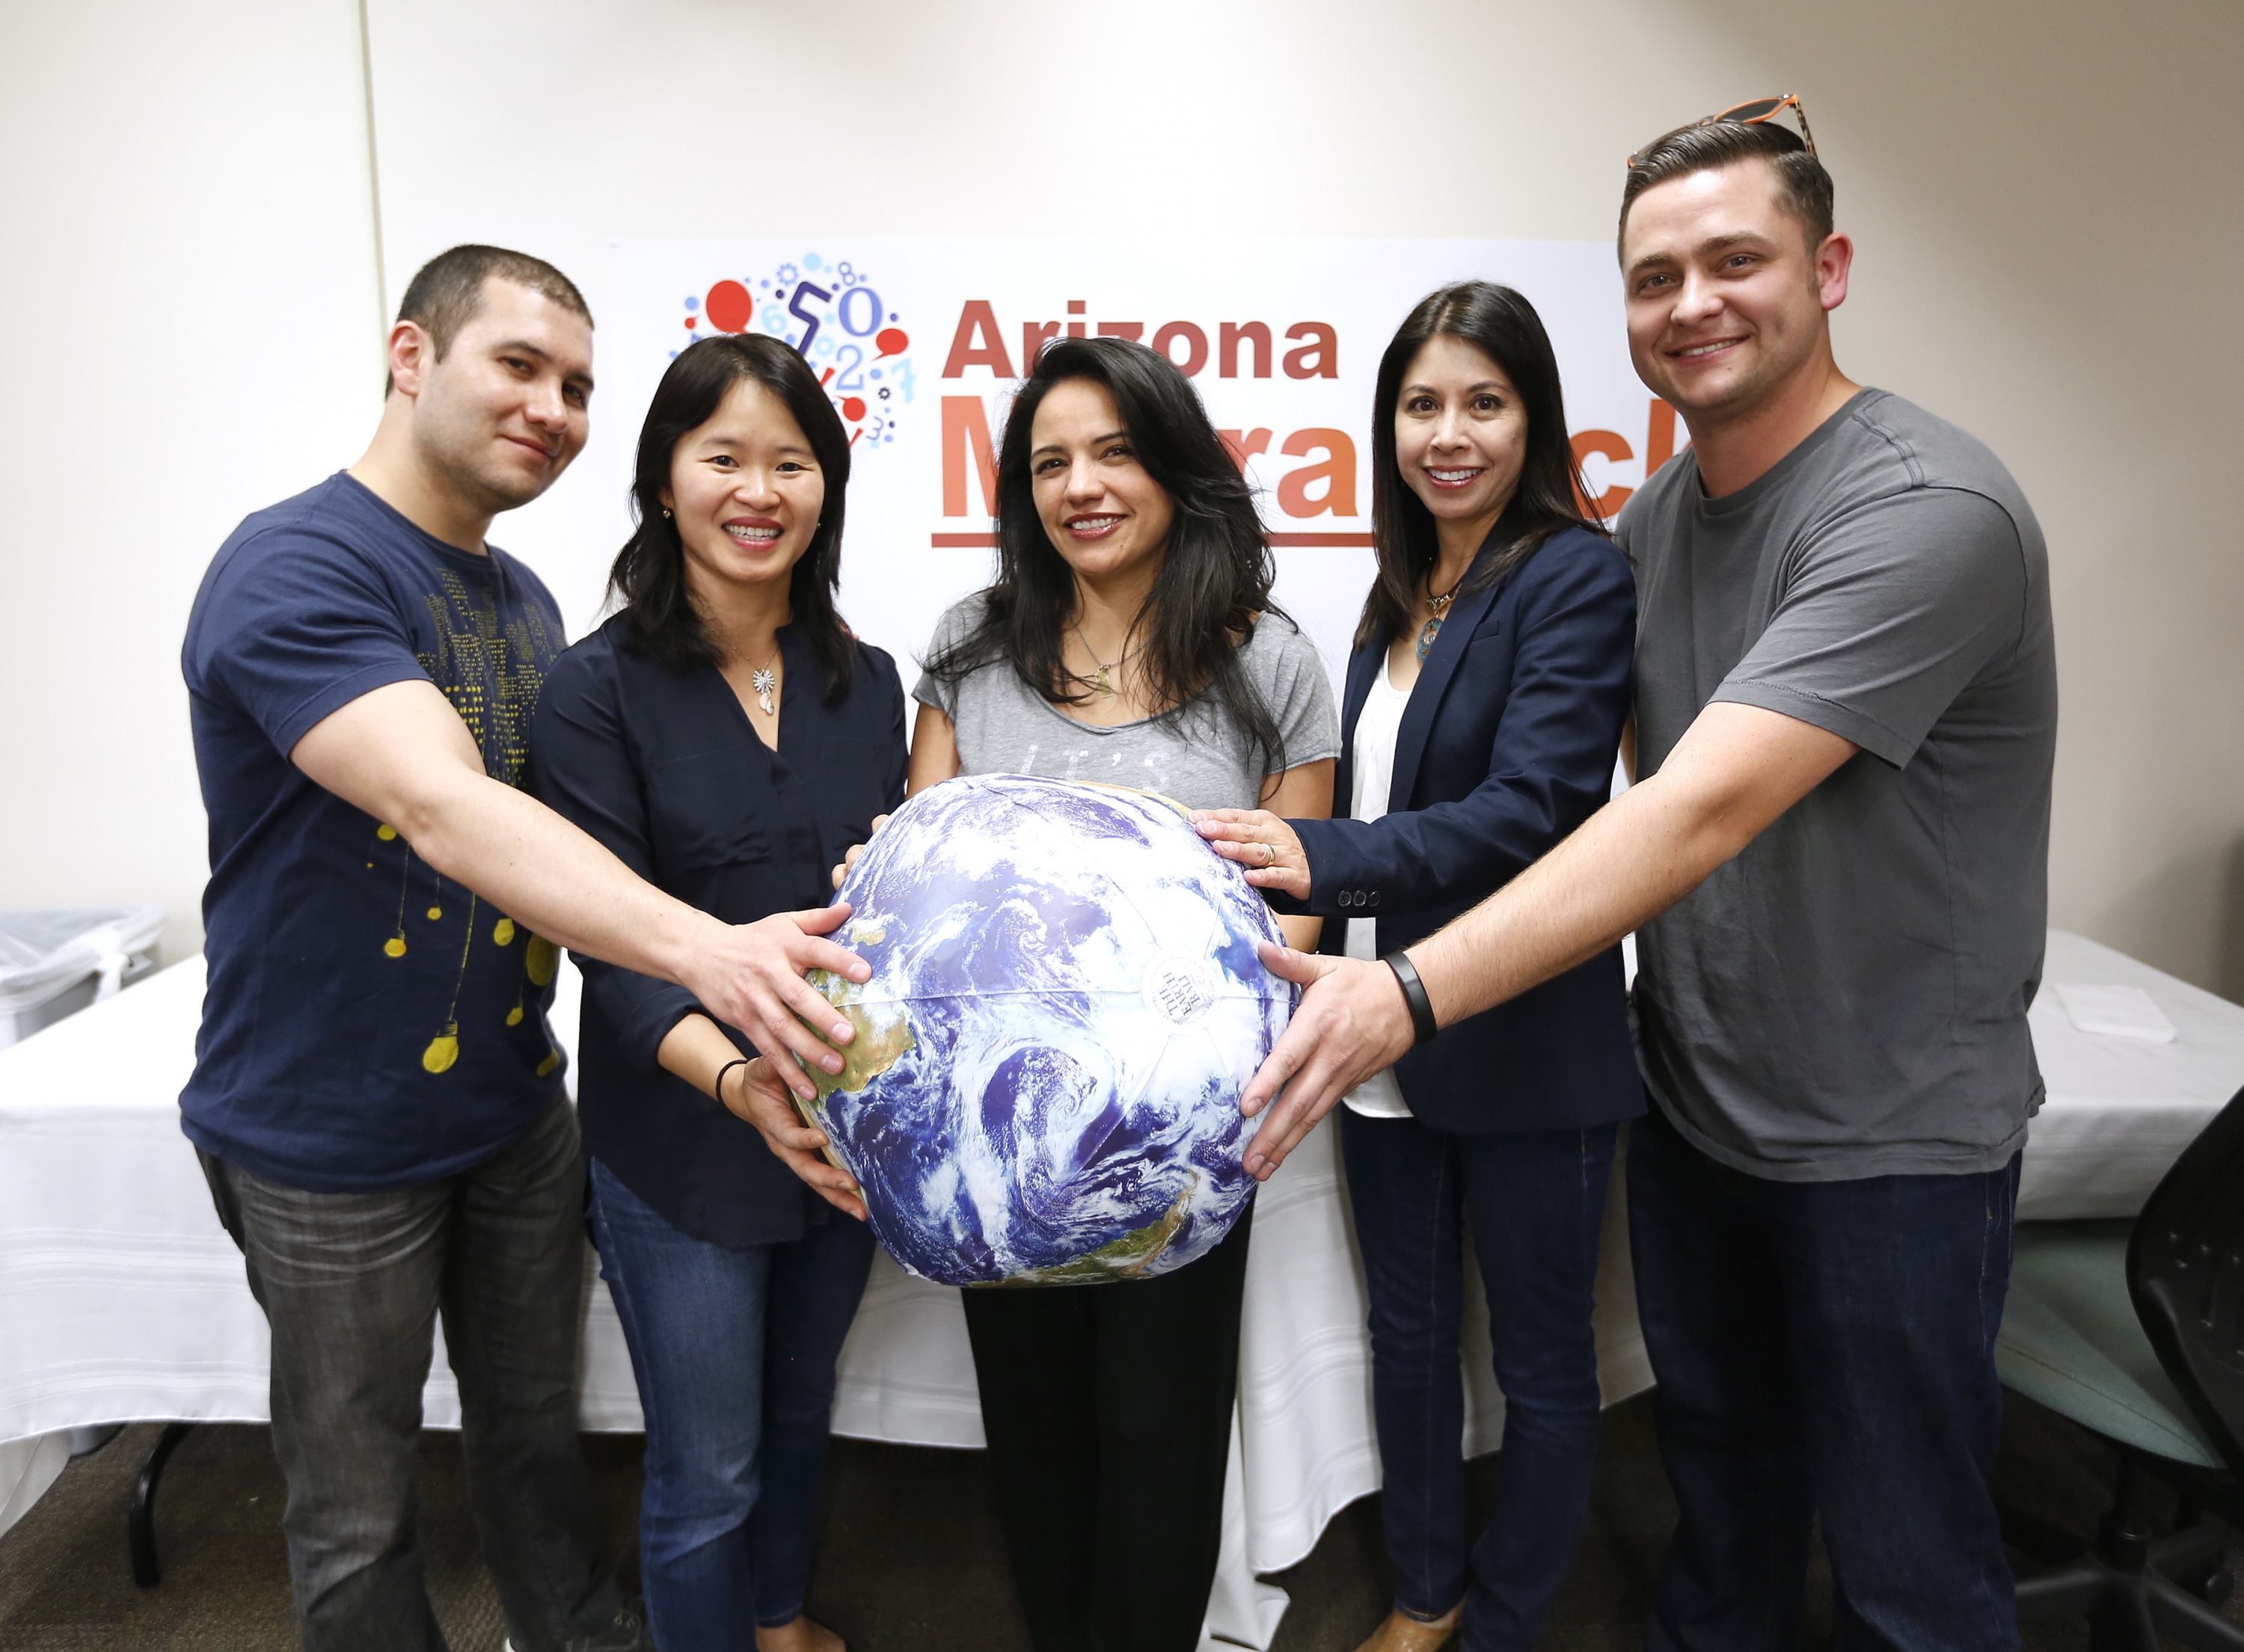
Above: Migrahack directors and mentors posing with a globe. Photo Courtesy of IJJ.
How It Worked
Attendees were divided into several teams, each mentored by an expert in the field of data or journalism. Some these teams are formed well before the competition while others are comprised of complete strangers. Team members had to work together to transform raw data into engaging data visualizations that communicate a compelling narrative. The reward? Up to $5,000 in cash prizes in addition to free data visualization training, new connections and a one-of-a-kind experience.
Since many attendees were new to data, Day 1 focused solely on education, giving attendees the chance to take advantage of free data visualization and analysis training (more on that below). On Day 2, they began working on their projects. And on Day 3, they presented their projects in front of their peers as well as a panel of judges who would determine the winners.
A Community Effort
Part of what makes Migrahack such a valuable experience for those who take part is avid support from both the data and journalism communities. Arizona Migrahack was jointly organized by IJJ and the University of Arizona, which enlisted the help of respected journalists and tech experts as mentors and trainers. These people graciously donated their time and knowledge to really enrich the work that Migrahack participants were creating.
Among those helping out was InterWorks Business Intelligence Consultant Ken McBride. Ken and InterWorks agreed to provide the free data visualization training for the event, and what do you think the tool of choice was? You guessed it. Tableau Software!
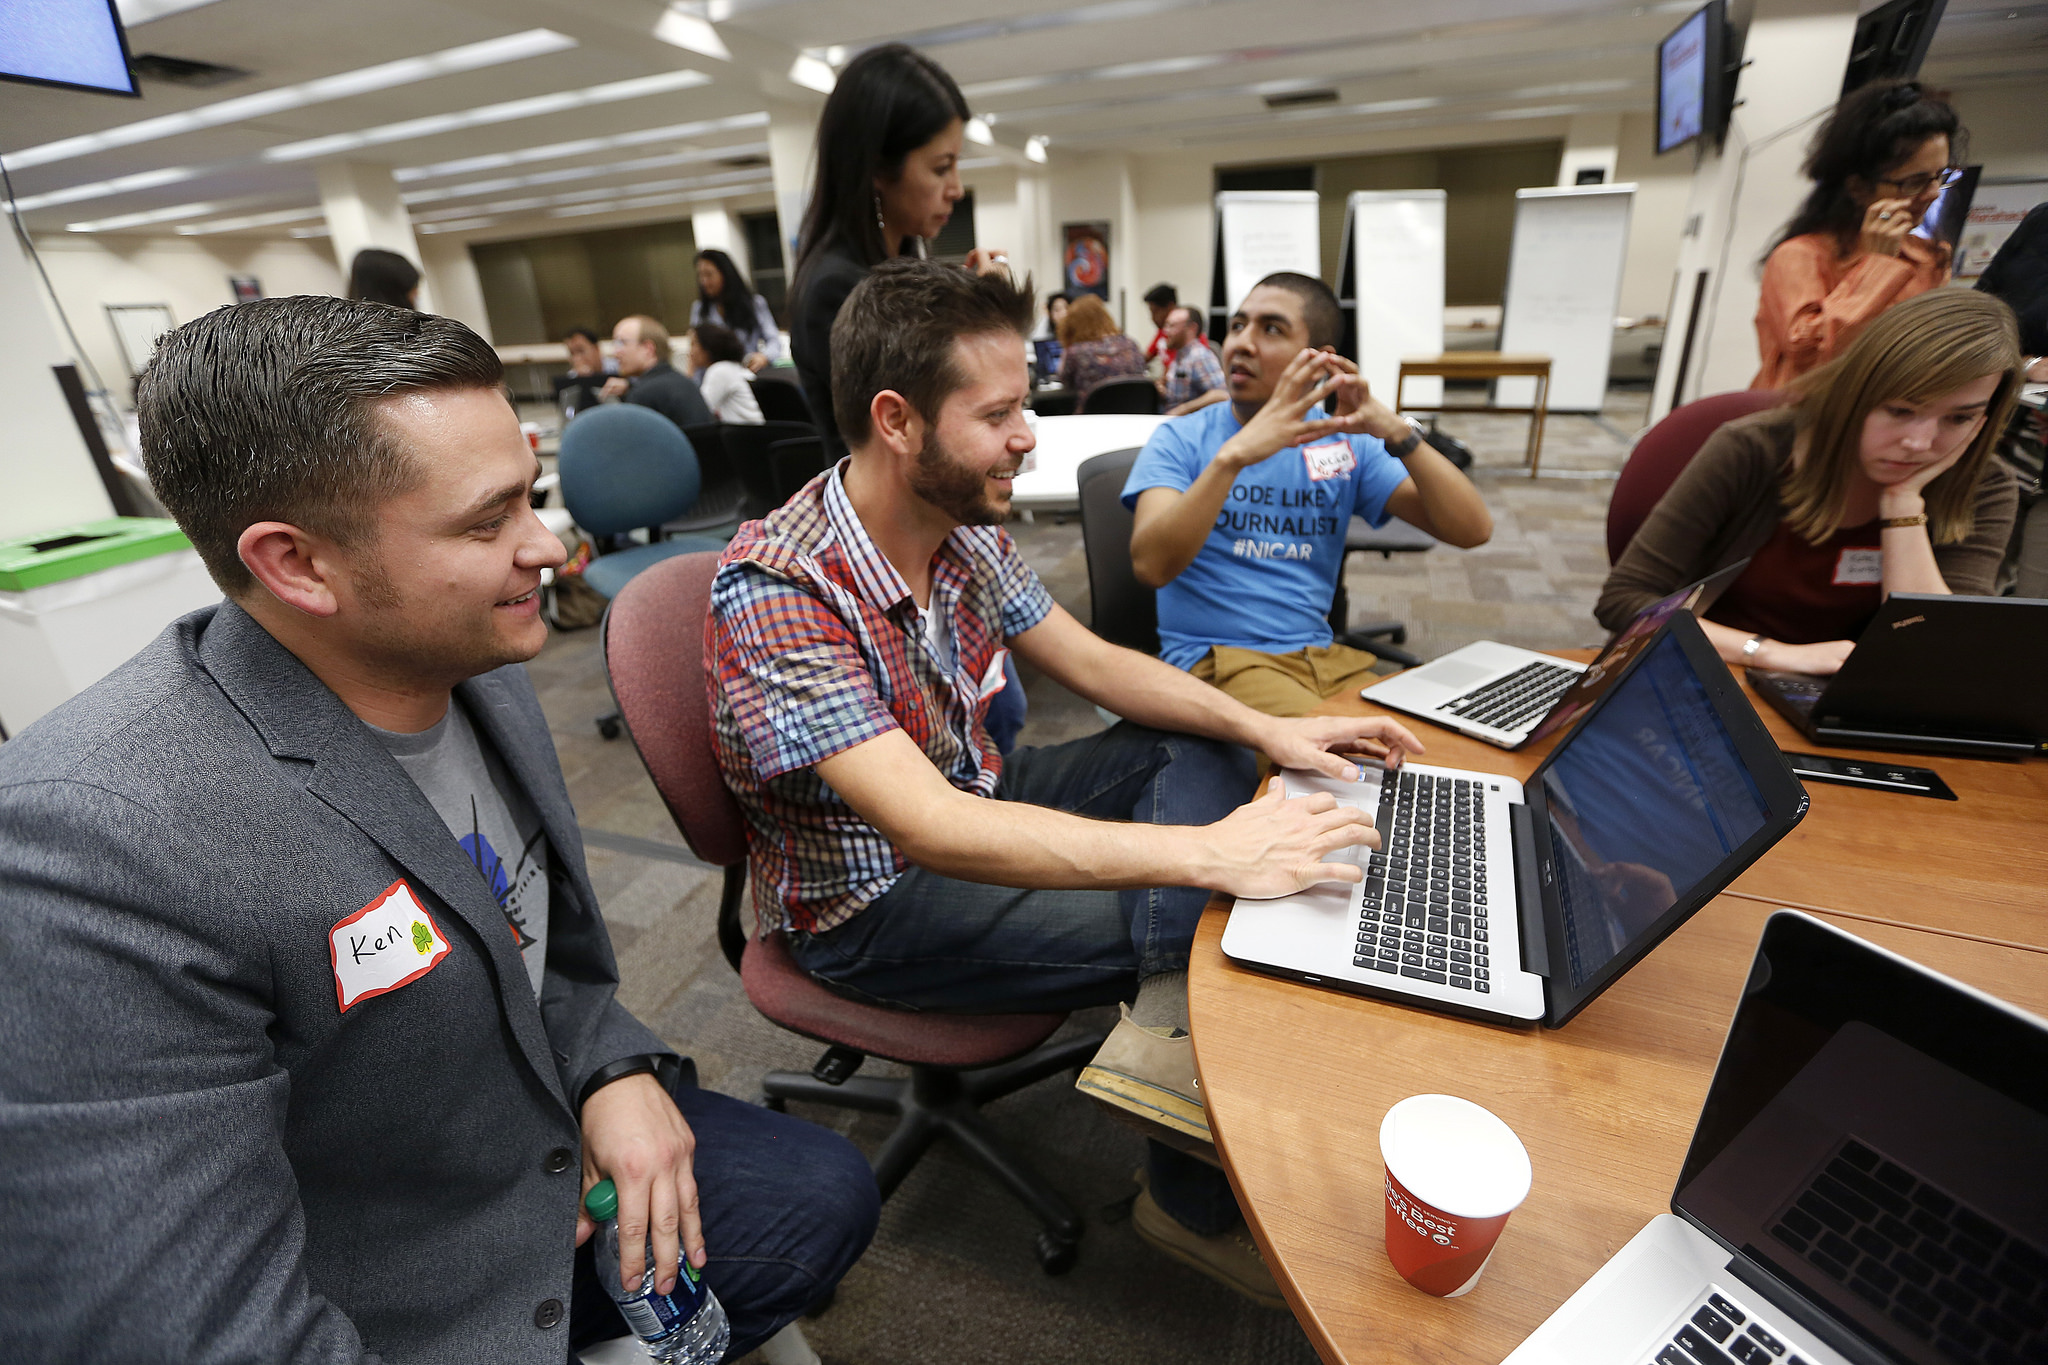
Above: Ken assisting Team Cactus Kings with Tableau. Photo Courtesy of IJJ.
Ken ran two different training sessions, one covering Tableau fundamentals and the other advanced techniques. The classes were packed with dozens of eager of participants ready to learn the magic of Tableau. This training was integral in helping students build their visualizations and shape their stories, and once they saw how easy Tableau was to use, they were sold. This was the second time InterWorks has been involved in a Migrahack event. InterWorks Director of BI Services and Tableau Zen Master Dan Murray taught at Chicago Migrahack in 2013.
“By the end of the sessions, I was certain that I wanted to use Tableau for whatever project I joined for the Migrahack,” said Kate Gunby, a participant and sociology Ph. D. candidate at the University of Arizona.
The Winners
This year’s competition featured so many fantastic entries, and with a topic as broad as immigration, the results were astoundingly diverse. But, when all is said and done, a competition needs winners. Fortunately, there were several different awards to be won, including Best Storytelling with Data Visualization, Best Data Insight, Best Data Visualization Team Project and Audience Favorite. You can check out all the winners in detail here.
We might be a little biased, but our favorite project was “No Lawyer, No Voice” created by Team Cactus Kings (journalist Astrid Galvan, doctoral student Kate Gunby, news applications developer Lucio Villa, journalist Brian White, journalism professor Jeannine Relly and journalism professor Susan Swanberg). Full disclosure, Ken McBride served as their mentor for the competition.
Their project included a slick web portal with embedded, interactive data visualizations created using Tableau Public. These vizzes illustrated the long and agonizing journey that unaccompanied child migrants face when going through the U.S. court system. Dashboards came in both English and Spanish, and they were designed with mobile compatibility in mind.
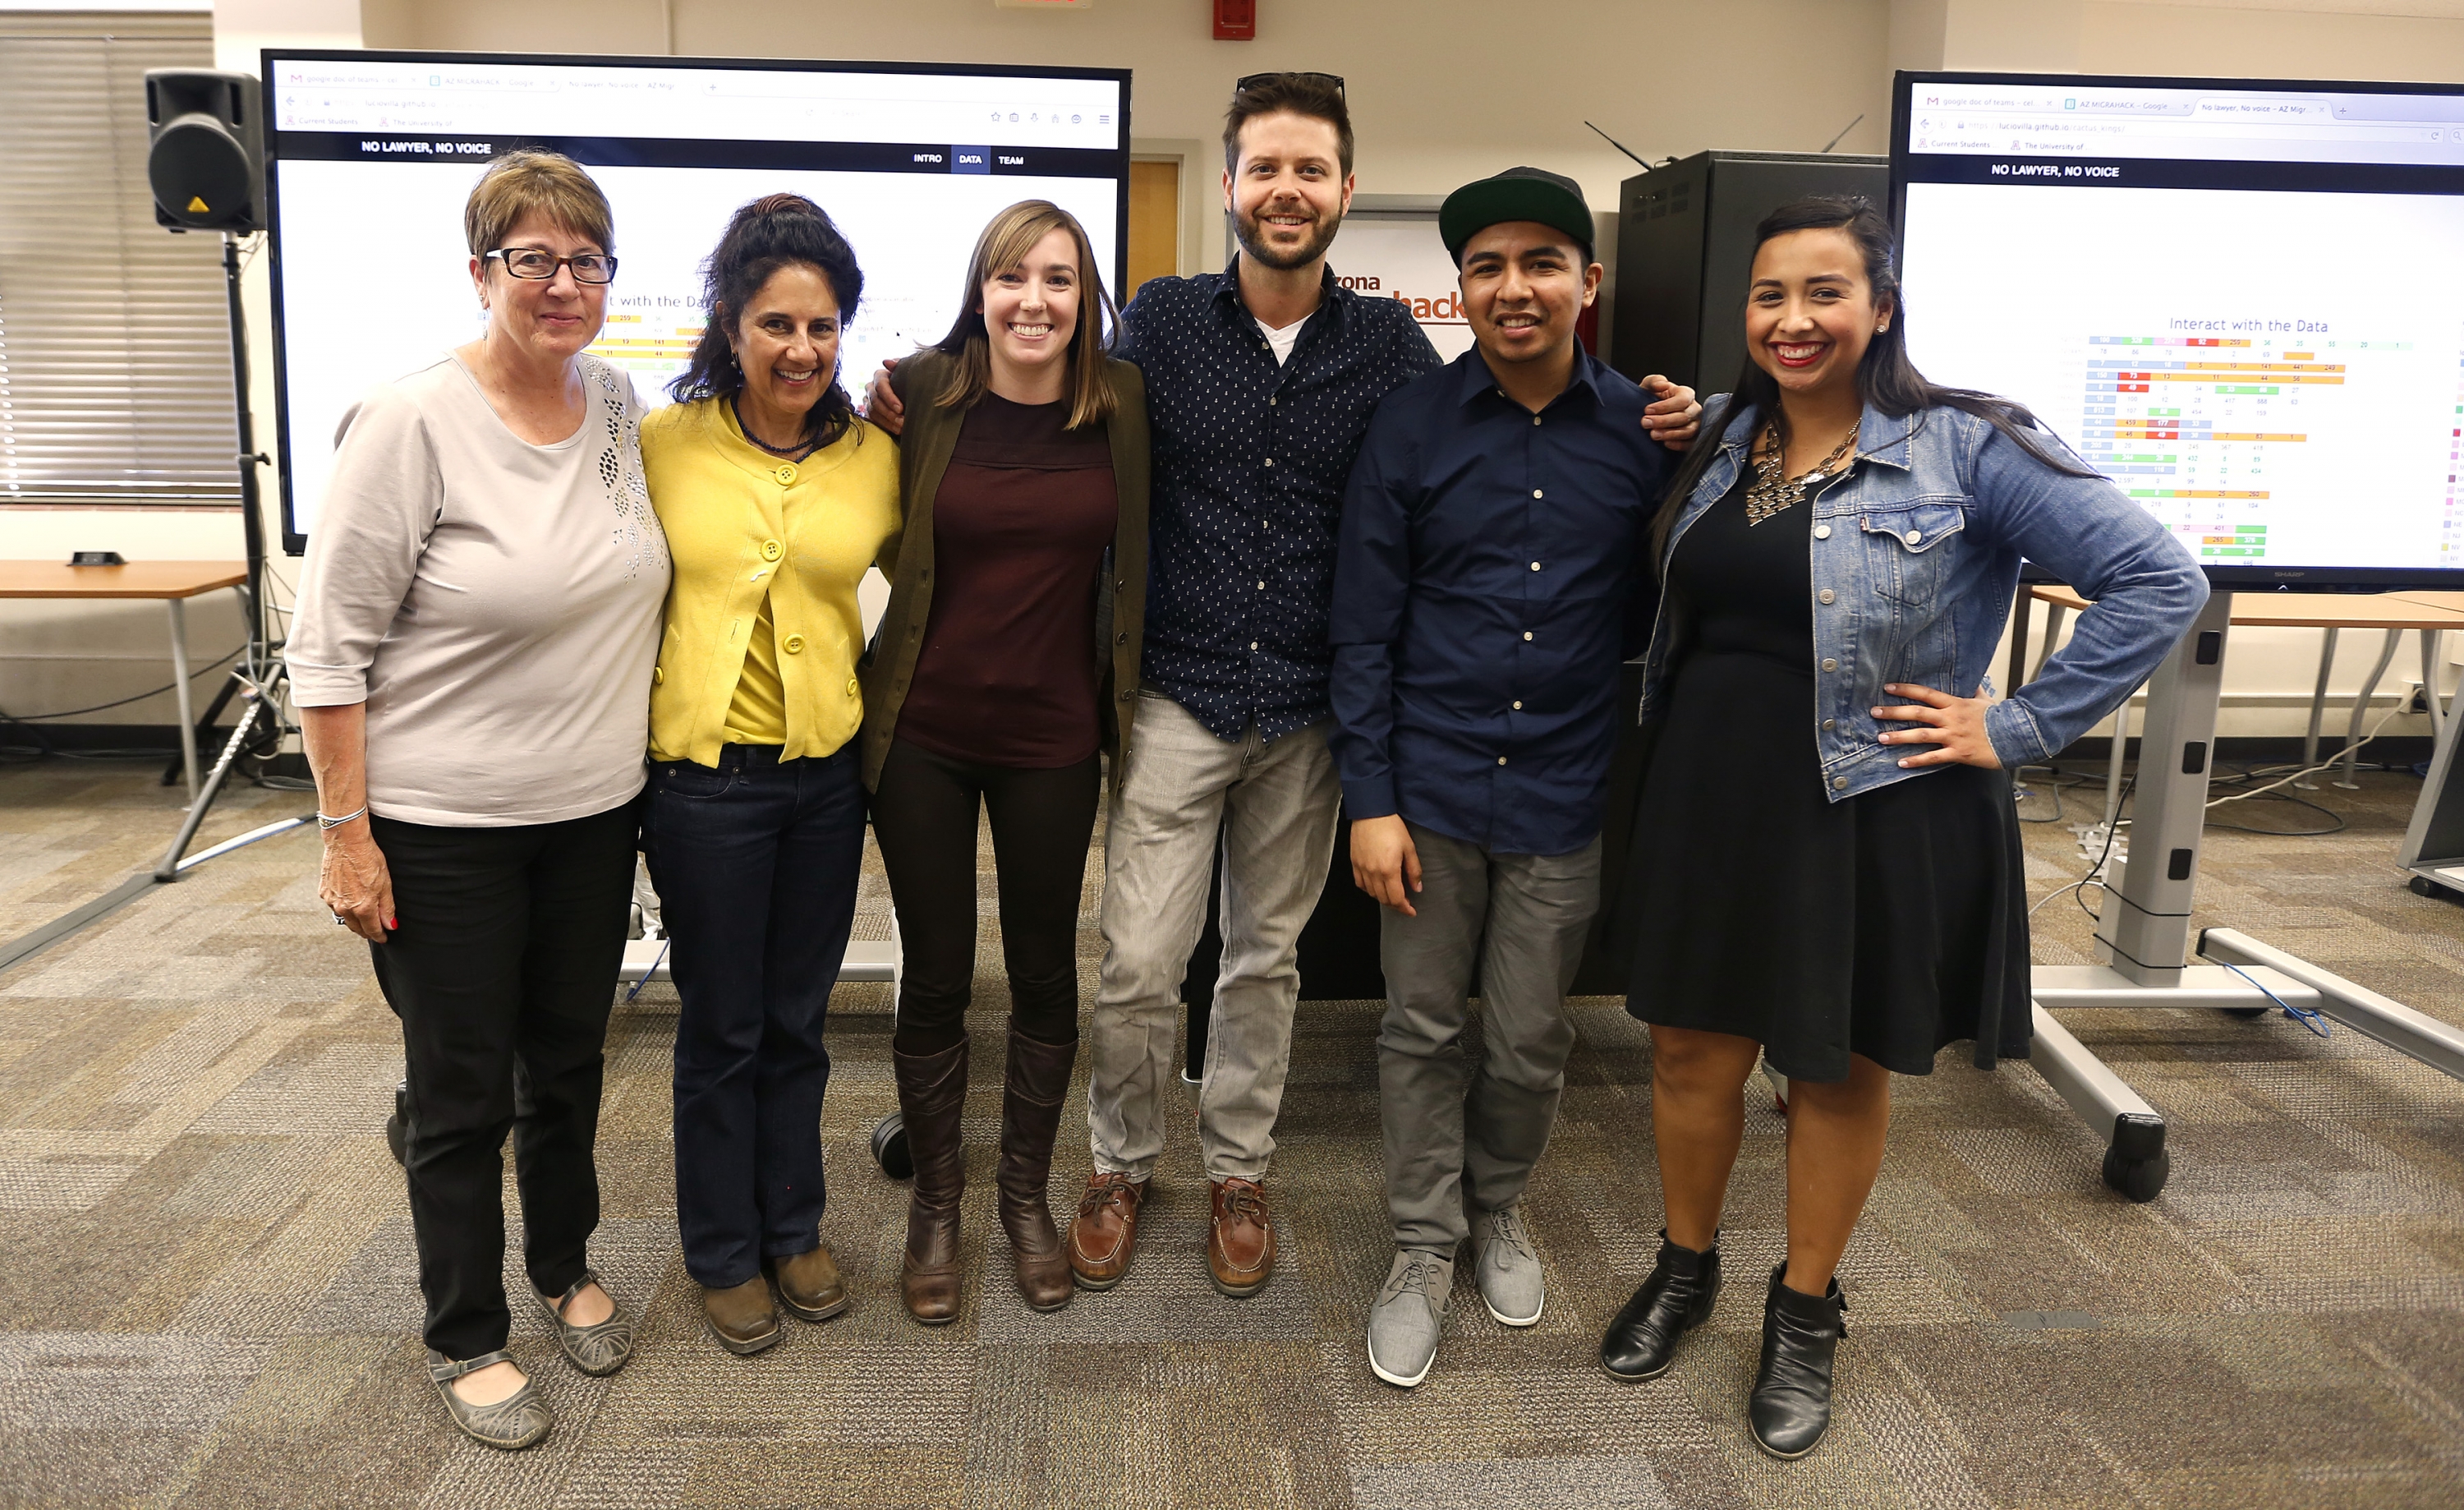
Above: Team Cactus Kings. Photo Courtesy of IJJ.
Perhaps most impressive was their ability to take a complicated data set and present it in a way that everyone could understand without losing any depth. That’s where Tableau was really clutch, allowing users to drill beneath the surface of their data for a level of discovery that a static visualization just can’t provide. Their excellent work won over the judges, and they were recognized as the Best Data Visualization Team Project. A huge shout-out to them for doing such a fantastic job! You can check out their entire project here.
Above: One of the vizzes created by Team Cactus Kings.
Democratizing Data
The beauty of Migrahack is that it has identified that data and journalism are on a converging trajectory. In the past few years, data has become a big deal in virtually every industry. It’s rapidly becoming more accessible, and the tools we use to analyze it have become easier to use.
In journalism specifically, data visualizations in publications like The Washington Post, The New York Times and countless others are no longer just a rare treat, they’re becoming standard. The reason why is because data visualization is the most effective way to communicate a story. As such, data skills are in high demand, but many barriers to obtaining these skills still exist.
Events like Migrahack are aimed at eliminating these barriers, introducing a whole new base of people to the power of data-driven analysis. Similarly, tools like Tableau were created with the same considerations in mind, allowing virtually anyone to jump in and start visualizing their data in minutes.
“We all approach issues with unique questions and our own perspectives, but so few of us have the skills and resources to actually explore data, so we often rely on media and academia to discern what is important and present it to us in digestible pieces,” said Gunby. “Luckily, the internet and social media have created new opportunities to democratize access to information, and Tableau can present quantitative data in an interactive and liberating way. Storytelling is powerful, but so is independent curiosity, and Tableau allowed our team to combine them.”
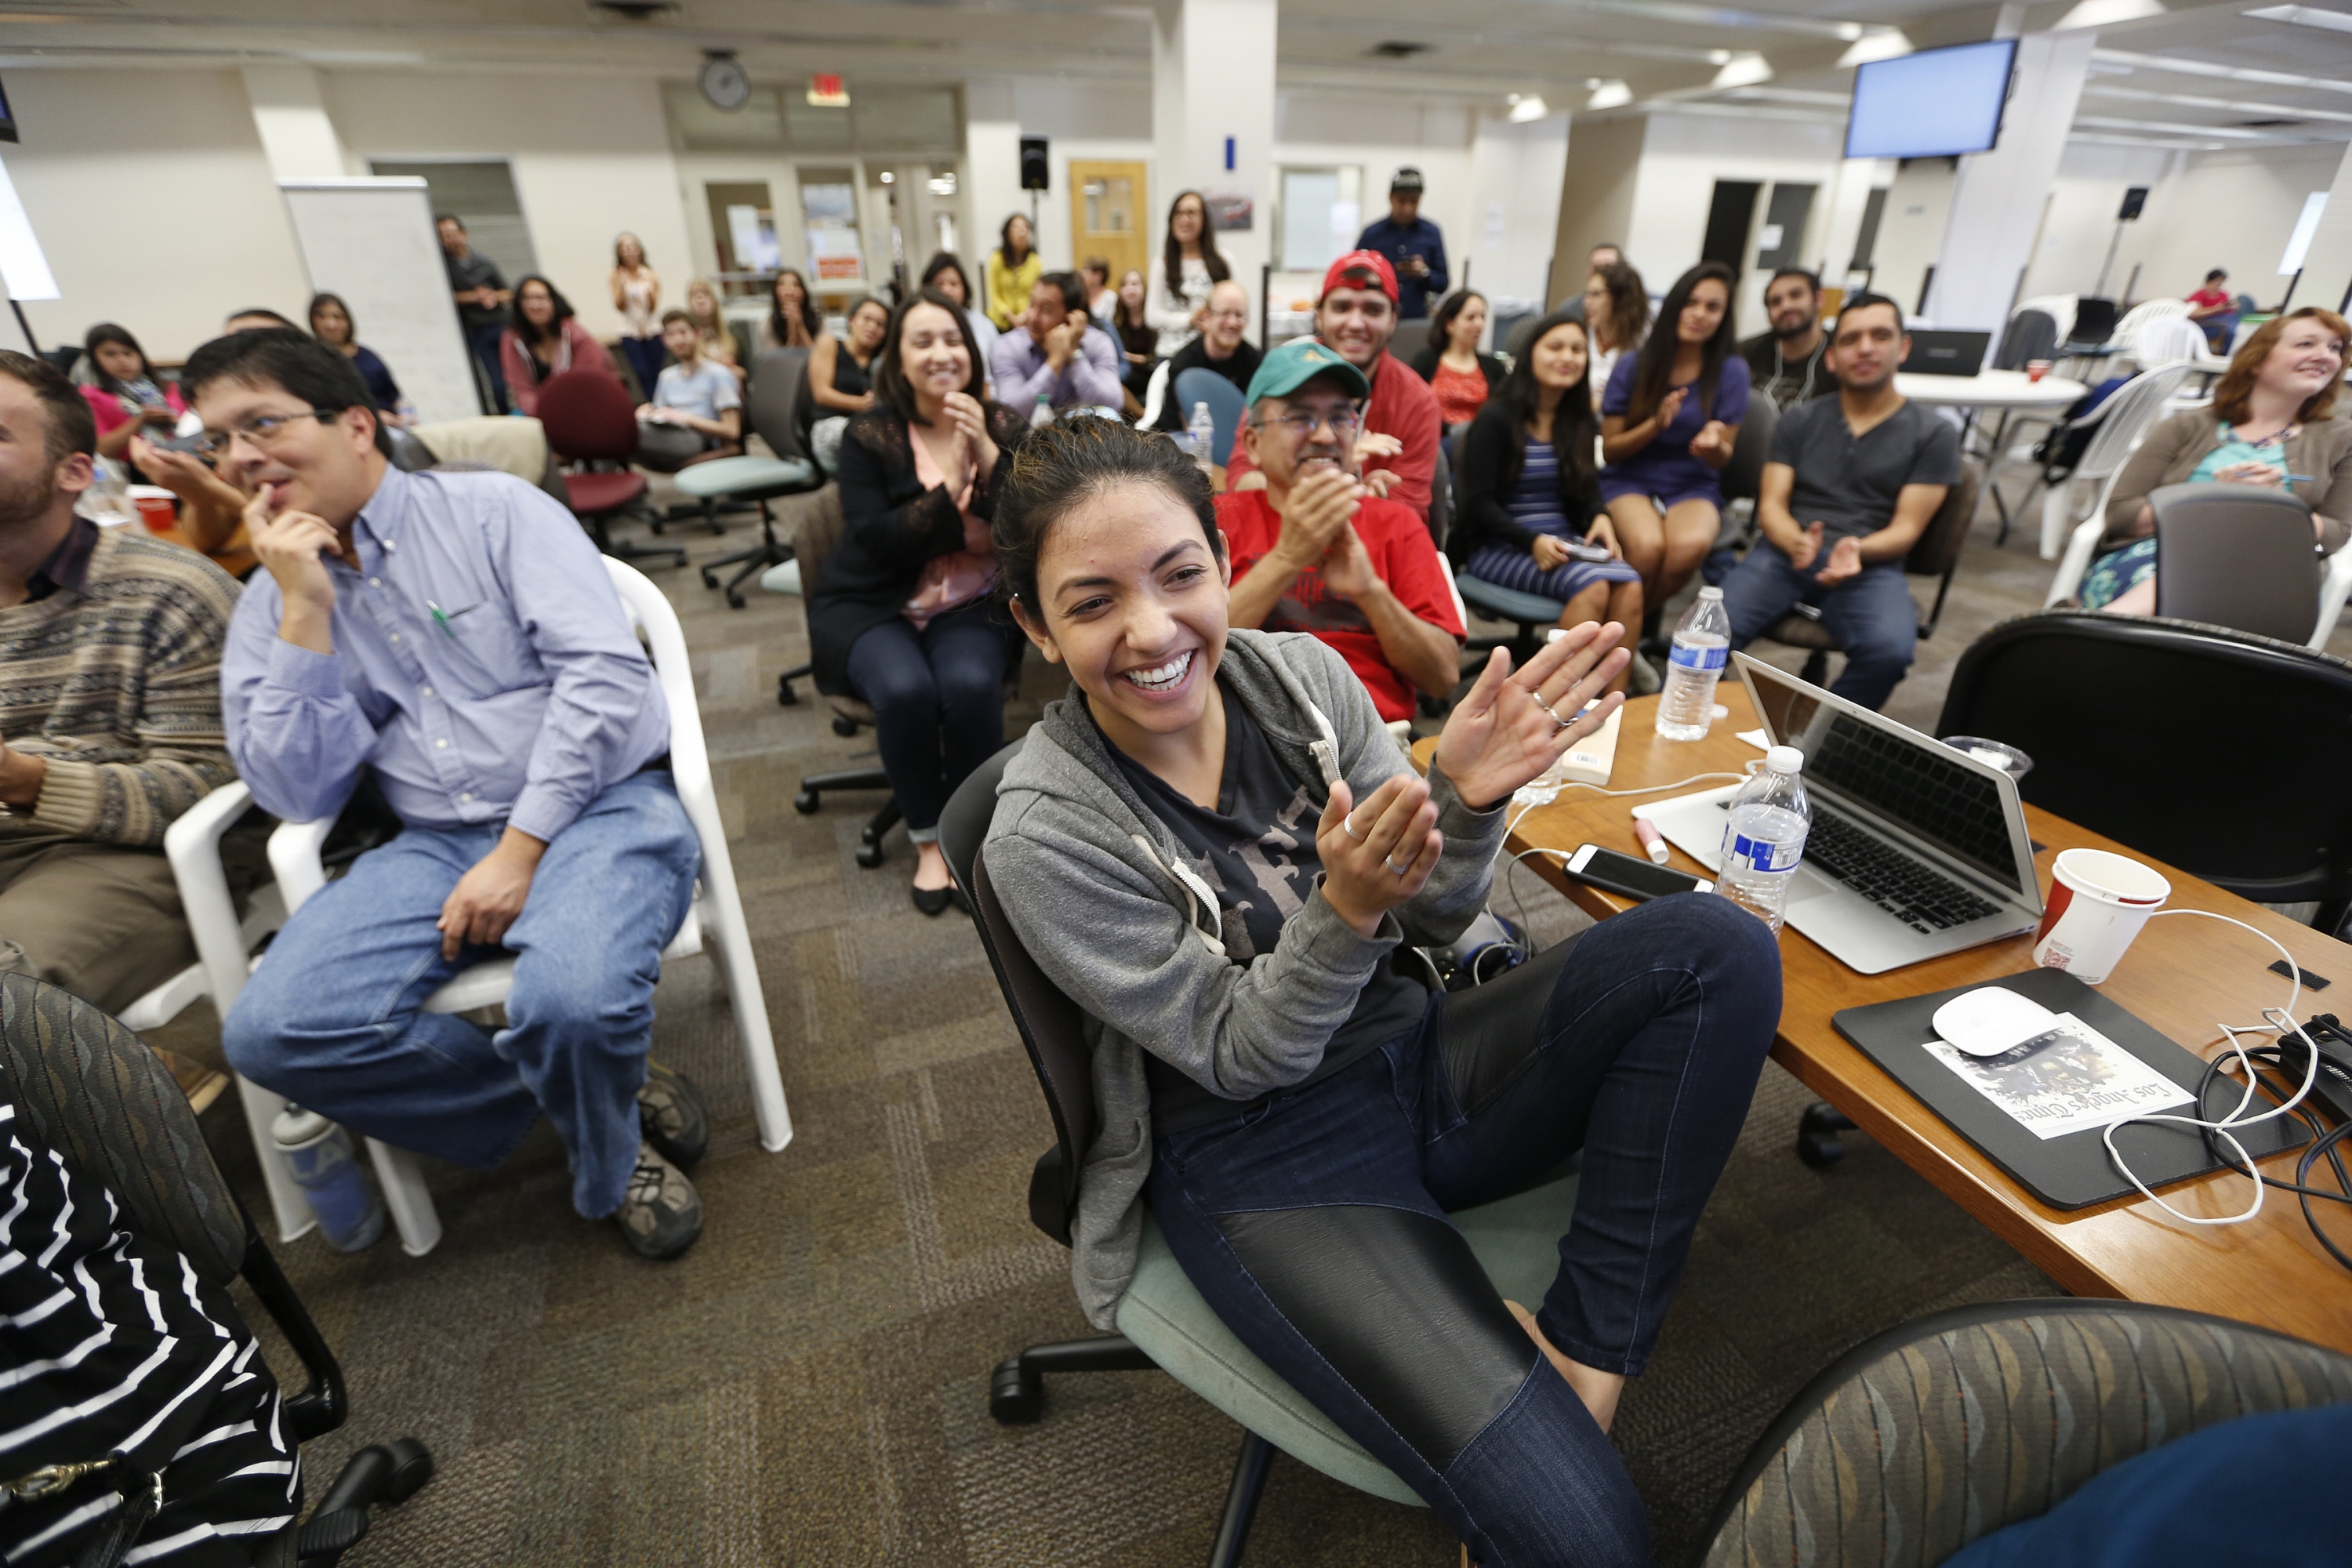
Above: Migrahack attendees applauding a presentation. Photo Courtesy of IJJ.
As a Tableau Gold Partner, there’s no doubt that InterWorks shares Migrahack and Tableau’s vision of bringing data to the people. That’s why we jump at the opportunity to help people see data differently, whether they’re one of our clients or aspiring journalists, sociologists and analysts at an event like Migrahack. Our mission is to help them gain insight from data that’s relevant to them.
By working together with like-minded organizations and individuals, we can increase the impact we have on a new generation of data visualizers. But it’s certainly not a one-way street. As more people become involved in the world of data, we see new perspectives and build new relationships that help us better communicate difficult issues like immigration. After all, better communication leads to better understanding, and isn’t that understanding the first step towards real progress?

