NCAA March Madness – The Seed Game

Data

NCAA March Madness – The Seed Game

by Tom McCullough
//

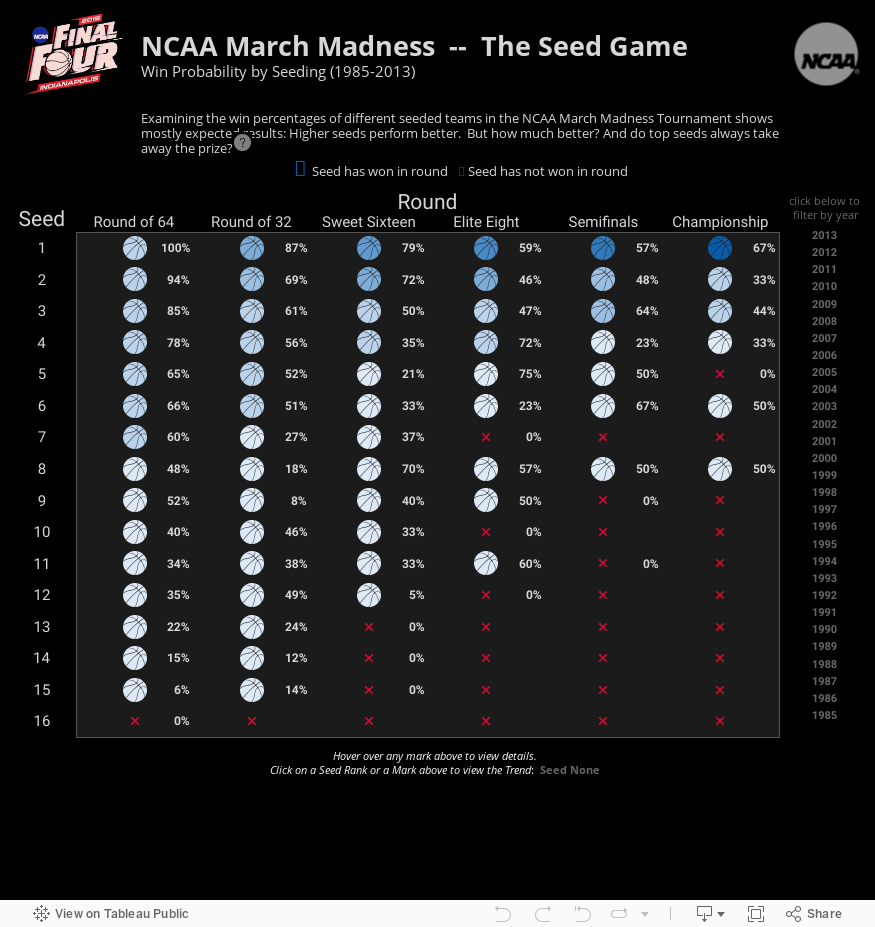
The NCAA March Madness Tournament is known for upsets. Each year, there are a few low-seeded teams that come out of nowehere and surprise everyone. It’s called March Madness for a reason. But how deep do these underdog teams really go in the tournament?

Using Tableau, I took a look at data from 1985 to 2013 to examine win percentages as they relate to tournament seeding. The results are about what you’d expect: Higher seeds perform better. But how much better? Is seeding everything? Take a look for yourself.

More About the Author

Tom McCullough

Solutions Architect
5 Tableau Tabellenberechnungen, die Du kennen musst Berechnete Felder erlauben es, Felder zu vergleichen, zu aggregieren, Logik anzuwenden, Strings zu verketten, Datumsfelder zu ...
New Default Setting in Tableau Server 9.1 Will Break Embedded Dashboards If you embed your Tableau analytics dashboards through either a straight embedded i-frame or with the JavaScript API, upgrading your ...

See more from this author →

InterWorks uses cookies to allow us to better understand how the site is used. By continuing to use this site, you consent to this policy. Review Policy OK

×

Interworks GmbH
Ratinger Straße 9
40213 Düsseldorf
Germany
Geschäftsführer: Mel Stephenson

Kontaktaufnahme: markus@interworks.eu
Telefon: +49 (0)211 5408 5301

Amtsgericht Düsseldorf HRB 79752
UstldNr: DE 313 353 072

×

Love our blog? You should see our emails. Sign up for our newsletter!