In this post, we’ll have a little fun with Brazilian Jiu-Jitsu or BJJ for short. I recently began training in BJJ at the Renzo Gracie Academy in Portland, OR. I feel very fortunate to have found a facility full of great people to be around, both on and off the mat. For those of you who aren’t familiar with BJJ, I’ll give you a little background. John Danaher, a highly-regarded BJJ instructor, uses the following definition:
“Brazilian Jiu-Jitsu is a grappling-based martial art whose central theme is the skill of controlling a resisting opponent in ways that force him to submit. Due to the fact that control is generally easier on the ground than in a standing position, much of the technique of Brazilian Jiu-Jitsu is centered round the skill of taking an opponent down to the ground and wrestling for dominant control positions from where the opponent can be rendered harmless.”
In a competition setting, a match, also known as a fight, may be won by points or by forcing your opponent to “Tap Out” as a sign of submission by applying a choke or joint manipulation. The International Brazilian Jiu-Jitsu Federation (IBJJF) is the governing organization for competitive BJJ. Now that you have a little context, let’s dive in!
Getting Started
Several of my training partners recently competed in the Seattle International Open, an IBJJF-sanctioned championship tournament. Eager to see how my teammates fared in the competition, I began searching for the tournament results soon after the event concluded. Fortunately, tournament data was pretty easy to find, and while I applaud the IBJJF for their efforts in making this data available, the format leaves a lot to be desired.

Above: Carsten Carlson representing Renzo Gracie Portland.
Following major competitions, the IBJJF provides two static PDF files, one showing Registrations by Academy, and one containing Event Results. When data is stored in this format, even simple analysis becomes extremely cumbersome. Aggregation? Nope. Sorting? Sorry. Trends over multiple events? Don’t even think about it! Like many data sources we encounter in our personal and professional lives, we can’t control the format of the source data provided by the IBJJF. Have no fear. We can still force this data to into submission!
For this exercise, I used the following tools for the following purposes:
- Excel – to get the data in a somewhat workable format
- VB – to parse the data points into individual rows and columns
- PostgreSQL – my relational database for transforming and cleansing the data
- Tableau – for data visualizations
Step 1: Restructuring the Data
We need to get the data out of the two PDF files provided by the IBJJF and into a system that allows the data to be structured for analysis. To do this, I copied the data out of the PDF files and pasted it into a single column in Excel. I used VB to parse the data and store each field in a single column and each record in a single row as shown below:
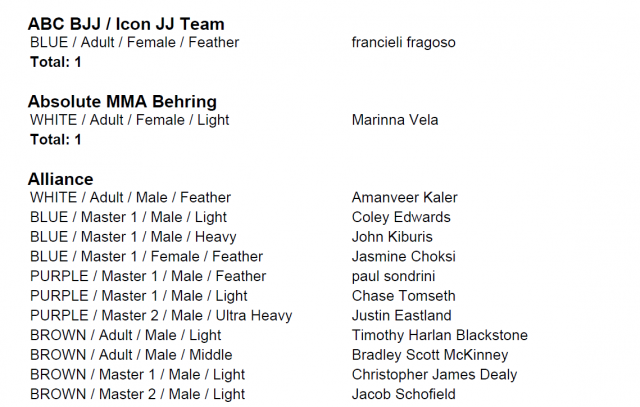
Above: A snapshot of the original IBJJF Registrations by Academy PDF file.
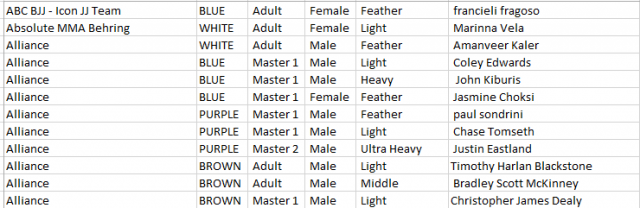
Above: A snapshot of the parsed Registrations by Academy Excel file.
I did the same thing for the Event Results file, so I have two Excel sheets, one for each IBJJF PDF file (Registrations by Academy and Event Results). At this point, I could simply use Tableau, my data visualization tool of choice, to connect to our two Excel files and build dashboards. However, as you may notice in the snapshot above, many of the data fields contain whitespace (leading and trailing) and type case inconsistencies. In short, the data format is still a bit dirty and difficult to work with, which brings us to our next step.
Step 2: Cleaning the Data
I loaded the data from the two Excel files to separate tables in PostgreSQL, but any relational database system will work. I used PostgreSQL to trim the leading and trailing whitespace and forced all fields to Upper type case for consistency, making the data much easier to work with. Finally, I wrote a custom view that combines the Event Results data with the Registrations by Academy data using a LEFT OUTER join. This enables us to look at the information in a more holistic manner.
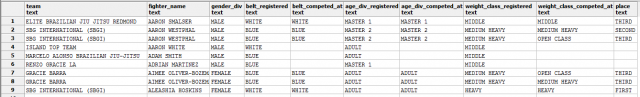
Above: A snapshot of the final clean output from PostgreSQL.
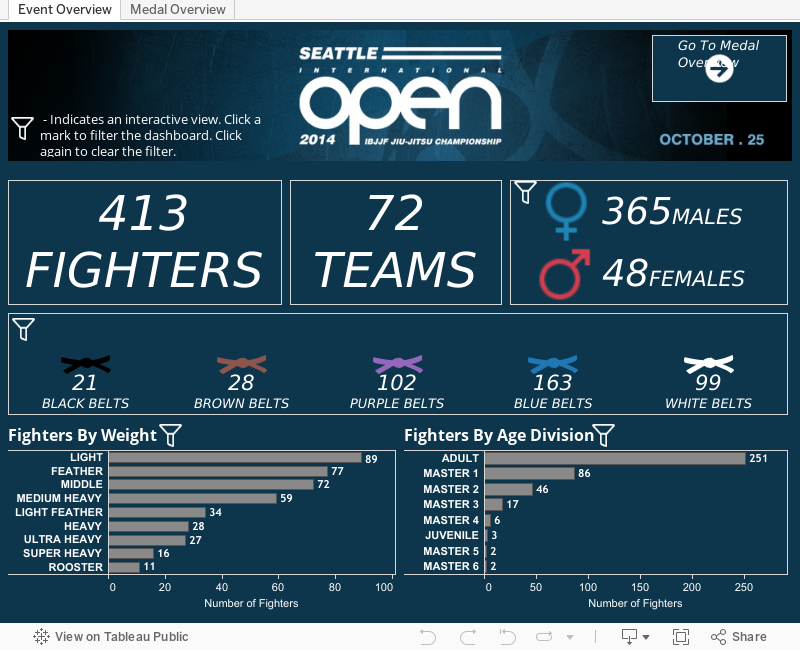
Step 3: Building the Data Viz in Tableau
Once I created the custom view in PostgreSQL, building the data visualization in Tableau was a piece of cake. For this example, I built two dashboards. The first dashboard (Event Overview) allows the user to see event details such as Total Number of Teams and Fighters, as well as the number of Fighters by Belt, Weight, Gender, and Age. In the second dashboard (Medal Overview), we examine the medals awarded. Both dashboards are interactive, inviting user clicks and allowing the data to be sliced and diced to the lowest level of granularity available. We can now look at the IBJJF Seattle International Open and in seconds, gain insights that were at best, extremely difficult to derive from static PDF files.
Those of you that are familiar with Brazilian Jiu-Jitsu know that the data provided by the IBJJF only captures a small subset of the information that could be made available. Data points such as method of victory (points or submission), type of submission used, and match time would be extremely interesting to work with. Additionally, if the IBJJF consistently provided the data in a more workable format, data could be stored in a manner that would allow us to analyze trends over multiple events. This would enable us to gain insights such as team performance over time, submission trends and even a fighter’s results over their entire competitive career!
Take a look at the final dashboards below. Click on the image to interact with the visualization. As always, don’t hesitate to reach out with questions or comments!