Tim Costello shares his Speaker Idol talk from SQL PASS Summit 2014. Speaker Idol is a speaking contest among 12 of the sharpest SQL minds in the industry. Whoever gives the best presentation wins. The prize is a speaking spot at next year’s summit.
“If you can’t describe it to your grandmother, you don’t fully understand it.” – William Butler Yeats
Hello! My name is Tim Costello. I’m a consultant with InterWorks out of Stillwater, Oklahoma, but I live in Dallas, Texas. Today I’ve come here to share with you how I introduce the concepts of dimensional design to my clients.
Telling Stories with Data
I like to describe the data warehouse as the ultimate platform from which to tell the story of the data.
There are three ways we might tell the story of our data. We might frame our tale as a short story that describes discrete, often unrelated events. We might tell a saga where we focus on the story as a journey through different milestones. Or, we might tell our story as an old-fashioned serial – where every month, the story picks up where it left off the month before and moves forward to the next cliffhanger (to be continued!).
Does it sound like I’ve been describing a data warehouse to you? I have been. Every modern data warehouse includes these data stories. We just call them different things in the back office, away from the end user.
The different ways we tell the story of our data translate into different types of fact tables in our dimensional design.
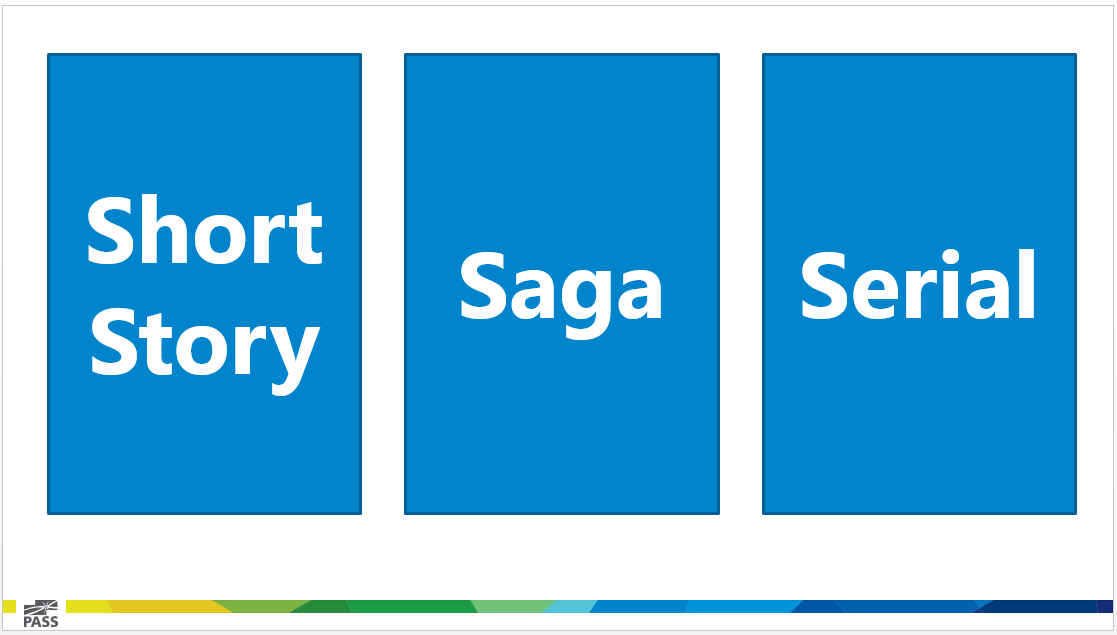
Above: Our three story types.
The Short Story
The short story becomes a transactional fact table. The transactional fact is the most common type of fact we deal with. It’s the data point recorded behind every point-of-sale transaction, every visit to a website, every time a hotel room is opened with a magnetic key card … you get the idea. These events are usually short in duration and have a beginning and end between the load cycles of the data warehouse.
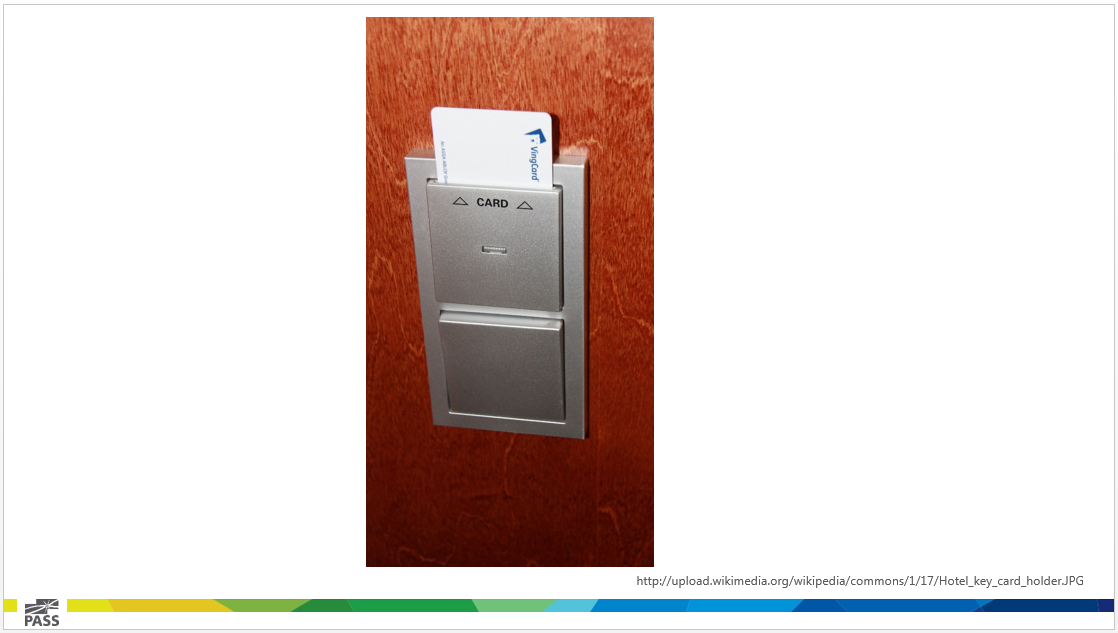
Above: Using a key card is a transactional event.
The Saga
The saga translates to an accumulating snapshot fact table. In this table, we track business events by their milestones. A classic example is this kind of event is the water cycle. Evaporation, condensation, precipitation falling down! This is the water cycle. It goes round and round and round!
A more business-focused example might be a college admission review cycle. The milestones might be something like this: submit, review, decision, offer, applicant decision, final determination. This kind of story would let us count how many applicants are at any stage in the process, at any given point in time. It also shows us how long it takes an applicant to move through the entire process or what the fallout rate is at each step. These stories bring update facts into the fact table as they occur over a period of time.
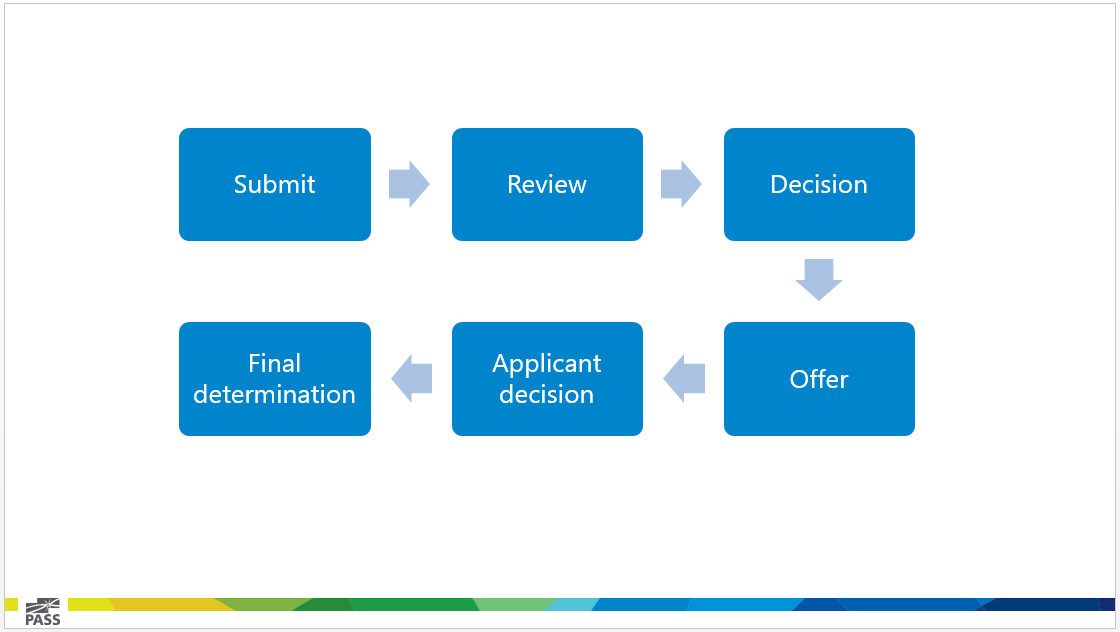
Above: College admission cycle milestones.
The Serial
The serial story becomes a periodic snapshot fact table in our data warehouse. This table holds aggregated detail at predictable intervals (daily, weekly, monthly). Common examples of this kind of story are the monthly account balance and charges for a bank account as well as the minute-by-minute audience totals for a television program. These stories aggregate details from past events and store those totals once in a fact table (hopefully, never to be changed once they are loaded).
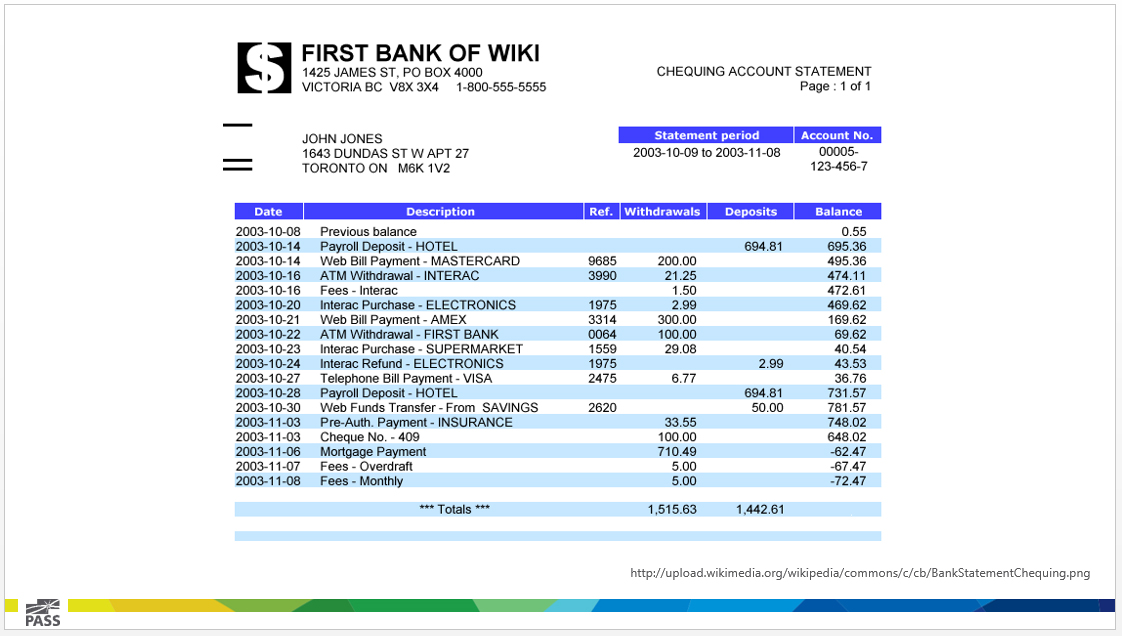
Above: A bank statement is an example of a serial story.
A Rich Set of Dimensional Details
Having a way that’s easy to relate what’s going on in our fact tables to our clients is a great start, but a data warehouse is more than a collection of fact tables. One of the most (if not the most) important elements of a data warehouse is a rich set of dimensional detail. Fair warning here folks: In my experience, when I start talking to a group of business users about the importance of a “rich set of dimensional details,” I get a lot of blank looks. Sometimes, someone starts to hum the theme to “Doctor Who.” From there, it just goes downhill fast …
The 7 W’s
I’ve found that a better way to explain dimensions is to break them down into the basics and talk about the 7 W’s (Who, What, Where, When, Why, How and How Many).
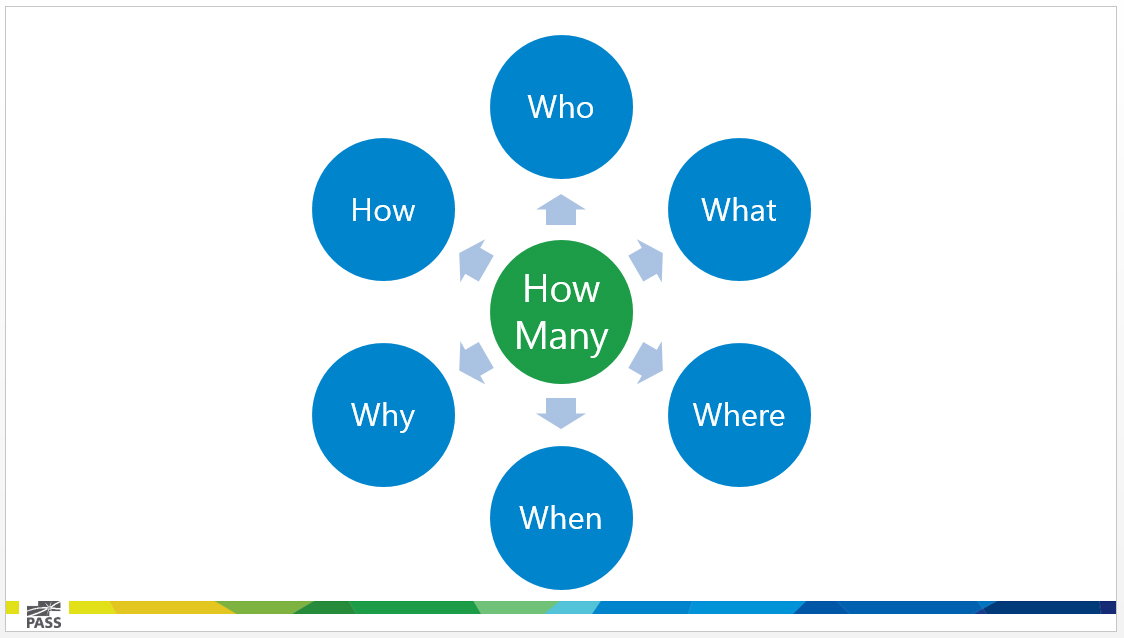
Above: The 7 W’s.
The first six give us our dimensions, the seventh is our fact table. You put these guys together and you get a Star Schema. The fact table in the middle contains the details of our story. These are the facts that drive our business forward. These are the things we measure to determine success. As cool as this is, the facts by themselves are meaningless without the dimensions that surround them to give them context.
An Example
If I were to say that I have one million dollars in profit, it would be meaningless (yet, I would still be VERY happy). No. To understand the importance of one million dollars in profit, we must know the context of that profit.
Was it one million dollars for one salesperson (Who), one product (What), one store (Where) or on one day (When)? Was there a promotion in place that made this profit possible (Why)? Was this profit all for one orderID or across thousands of transactions (How)?
It’s the 7 W’s that we use to create and fill our dimension tables that give us the context we need to properly appreciate our measures. They also help us to slice, dice, group, order and label the output of our data warehouse when we move into visual analytics.
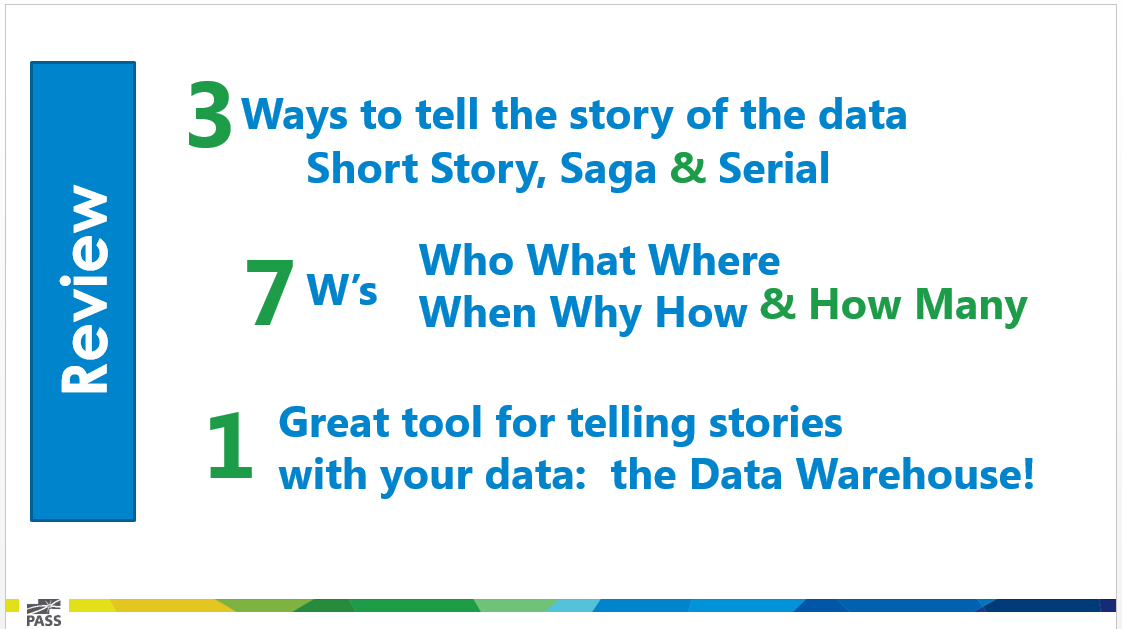
Above: Everything in review.
Well, I hope y’all have enjoyed my talk. If you want to share some love, I am @TimCost on the Twitter. Be sure to check back for the full PowerPoint slide deck.
Thank you!

