
I gave up getting angry for Lent this year, so I won’t start this blog post ranting about how difficult it is to get my data out of my own FitBit Alta tracking device. Suffice it to say, it is VERY DIFFICULT TO GET MY DATA OUT OF MY OWN FITBIT ALTA TRACKING DEVICE. (I wasn’t yelling. Caps Lock key was stuck, true story.)
But once I got over that hurdle, I had everything I needed to determine whether or not it was time to buy new running shoes. As the wisdom goes, you shouldn’t put more than 1,000 miles on a pair of sneakers before you replace them. Something about the cushioning going soft (boy, can I relate) and the tread wearing down … sometimes I wonder if it’s all just a marketing ploy. Nevertheless, I’ve bought into it and to save my pushing-50 joints from getting destroyed from pounding the pavement, I dutifully replace my sneakers on schedule.
I also dutifully wear my FitBit Alta even, and especially, while sleeping so that I can track all the things. The main thing is, of course, miles covered. I am a runner, have been since I was about 20. My modus operandi in those early years was to run six miles a day, six days a week. I’m slightly less fanatical about it these days, as my body just can’t take that kind of heat anymore. I’ve settled on a routine of running about four days a week. Any given run is no less than a 5k, so at least 3.1 miles.
Because I know the general number of days a week I run and how many weeks have elapsed since I last purchased some new Nikes (sometime around the first part of September so I could break them in for the Huntsville Turkey Trot on Thanksgiving), I could simply do the math in my head. And then die of boredom in the process.
Not ready to give up the ghost yet, I skedaddled on over to the FitBit.com website and spent the next hour (p a i n s t a k I n g l y) downloading my data into single-month excel files. What follows is the complete process it took to get my data ready for Tableau. After that, you can take a look at the dashboard that will tell me whether I have passed the required 1,000-mile mark and can then justify the cost of new running sneakers to my husband. He’s a pretty easy sell, but with the visualization to prove my case? I’ll be on Amazon.com in a flash. If necessary, of course.
The (No-Pun-Intended) Steps to the Dashboard
Here we go, in order:
- Download data from FitBit.com into .xls format. You have the option of .csv, but for my purposes Excel was a better choice. You don’t have to be a premium member to get your own data anymore, so this is a step in the right direction. But you do have to download it a month at a time (max of 31 days of data at time), and you must refresh the screen before you configure each month’s data range, because the calendar control quits working after each download. Feature? Bug? Who knows, deal with it and move on, unless you didn’t give up getting angry for Lent, in which case feel free to curse the programmers who built that blasted interface.
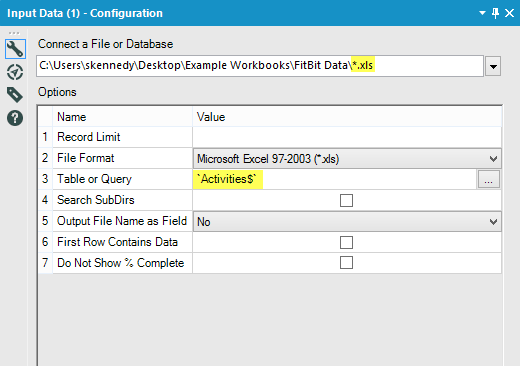
- I used Alteryx, the best thing since sliced bread, to import the data from both the Activities tab and the Sleep tab in each .xls file. Here’s a look at the configuration of the Input tool. By using a wildcard in the Input Path field, Alteryx will loop through all the files in the selected folder and pull the data from the specified tab.
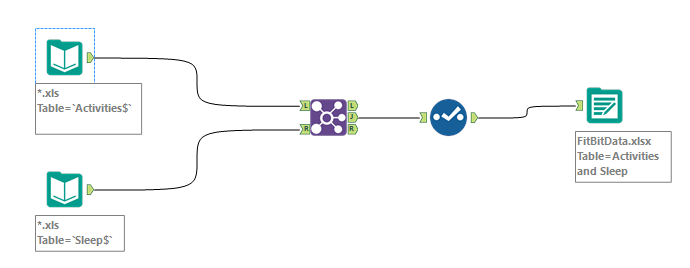
- I repeated Step 2 with a new Input Tool, but selected the Sleep tab instead this time. I wanted to be able to show a correlation between how much sleep I get and how many calories I burn.
- Still in Alteryx, I used the Join tool to bring together the results of the Activities and Sleep tabs. This way, I have a single file that includes data from every month for both data tabs I wanted. There were some minor data type adjustments needed (string to Date format, strings to decimals, etc.), but Alteryx’s Select Tool can easily handle that. Best part? I saved the workflow, so now all I need to do going forward is download the current month’s data and rerun the workflow. Done and done. Here’s the completed workflow:
- I then connected to the resulting final Excel file in Tableau, and built myself a dashboard that I can use going forward.
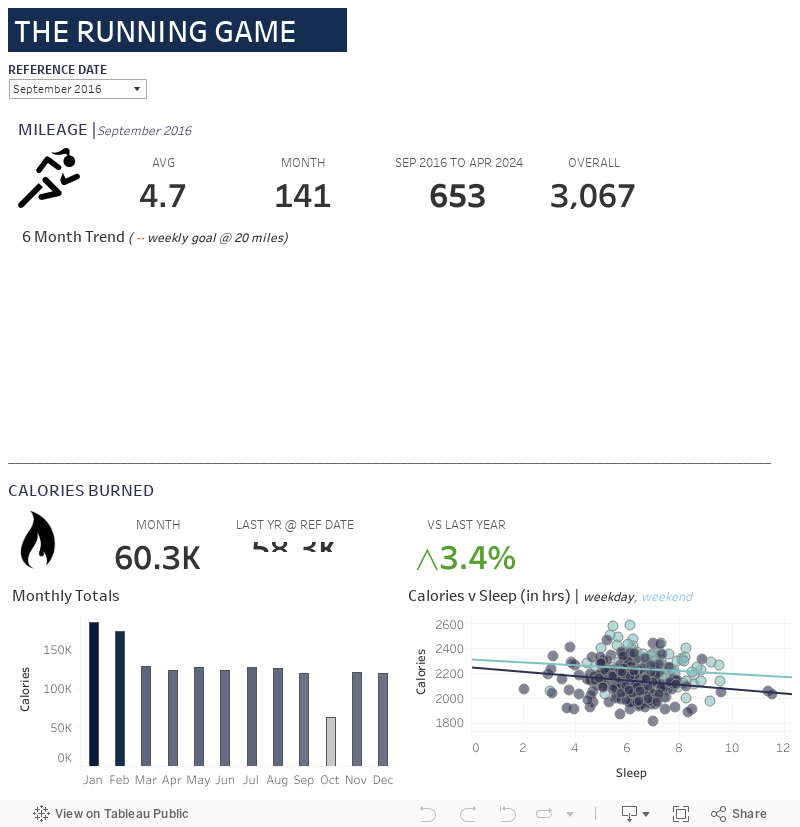
The metric I need for this analysis is the “REF DATE TO PRESENT” number. This will allow me to pick my Reference Month, which in this case will be September 2016, and the dashboard will tally up the number of miles I’ve run from that date until the current date. Once that number hits 1,000, It’s time to go shopping!
Go Time: Shoes or No Shoes?
At the time of this writing, I have only run 653 miles since last replacing my sneakers. *heavy sigh* Alas, while that would get me all the way from my hometown outside of Houston, TX, to the OKC office of InterWorks, it’s not quite enough to justify some new kicks.
Next month, Nike. Next month.