
Have you ever come across a problem where you would like to visualise the data to understand it better? If the data resides in a table on a website, how would you solve it? Typically, people try to export the table or copy it into Excel and then connect Tableau to it.
However, there is an easier way that not only saves time copying any data into Excel, but also updates automatically when any changes are made to the table you are scraping.
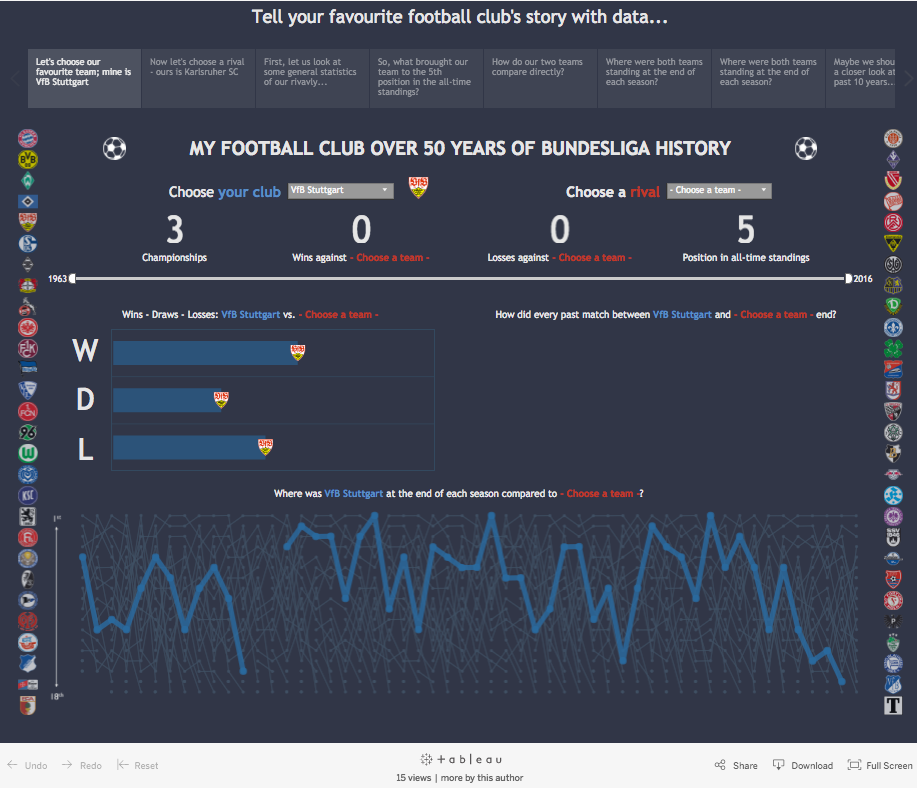
My Bundesliga Football Viz
Before explaining this process, I’d like to show an example of when this technique can be useful. In the dashboard below, you can choose any football team (soccer for you Americans) that has played in the German football league, Bundesliga. You can compare its performance over time to that of your rival team. The data used in this dashboard originates from a website that compiles the results for every season and match in an HTML table. You can view my final dashboard here, as well as my German version here.
The tool used to scrape those HTML tables is nothing more than good old Google Sheets. What if we wanted to add live league standings to one of our dashboards? Instead of copying a table every week to update the standings, we could connect to a website via Google Sheets and use the Google Sheets connector in Tableau to pull that data into our analysis. The owner of the website would technically be doing the updating for us. Setting this up, as you’ll see in the steps below, is relatively easy!
Step One – Scraping the Data with Google Sheets
In a new Google Sheet, type the formula:
= IMPORTHTML(“The URL of the website the table is on”, “table”, “index number of the table on that website”)
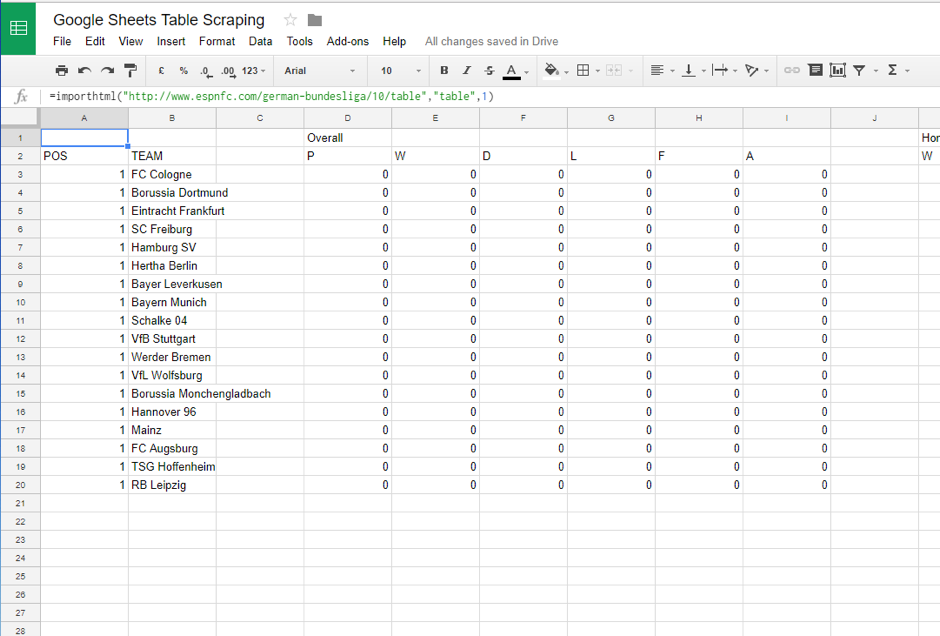
You can find this sheet here.
For this formula to work you will need two things.
- A website where you’re getting your data from.
- The index number of this table on the website.
This is easy enough when there is only one HTML table on the webpage, such as Bundesliga, but some websites are a little more sophisticated. Take Soccerstats, a website that, in addition to the current standings, shows you matches and statistics on past performances of the teams. In this case, you would have to go through the source code of the website and find the index number of the table by counting how many HTML tables there are.
Step Two – Connect the Scraped Table with Tableau
Since the release of Tableau V10, it’s possible to connect Google Sheets directly via the Google Sheets connector, just like you would with an Excel spreadsheet. You can even use the Data Interpreter!
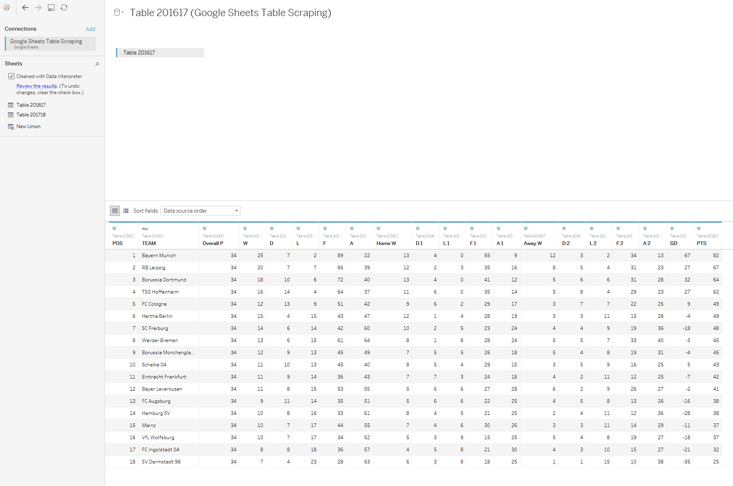
Above: Our table in Tableau cleaned with the Data Interpreter.
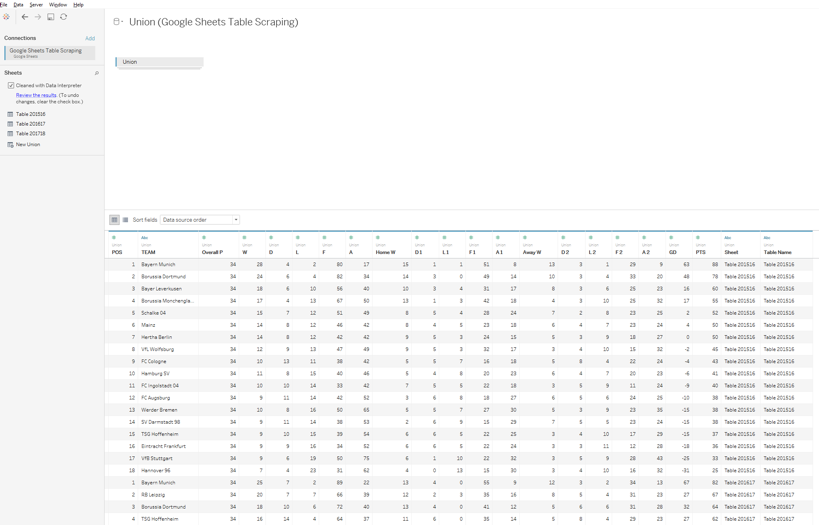
If you are looking at several tables, perhaps to make comparisons across seasons, you can union these tables just like I did with our Bundesliga standings below.
Step Three – Update the Tables
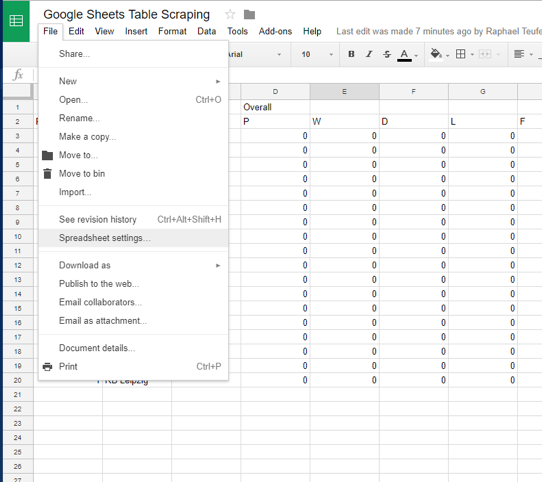
To set an update or recalculation schedule for the sheet, navigate to File and then open Spreadsheet Settings. In Calculation, set Recalculation to On change and every hour.
For your IMPORTHTML functions to update with the selected schedule, you need to change your functions so it will depend on one of the functions that are recalculated every hour: NOW, TODAY, RAND and RANDBETWEEN.
= IF(DAY(TODAY())=DAY(TODAY()),IMPORTHTML(“The URL of the website the table is on”, “table”, “index number of the table on that website”)
From here, you can change the data to fit your personal preferences. Calculated fields, parameters and dashboards will all be updated automatically with your scraped web data.
That’s it! Let me know if you have any questions or Tableau tips.
Resources