
Tableau’s Device Designer helps you lay out dashboards to fit different screens, but designing for mobile is about more than screen size. Once you’ve sized and arranged everything, you aren’t done until you consider how mobile interactions differ from laptop or desktop computers.
Let’s go through some of those differences and how they affect user experience.
Fingers Are Bigger than a Cursor
Tableau modifies filters and parameter controls to make them easier to touch. But, it won’t automatically change the size of other things users may want to tap. If a dashboard is set up to filter a chart based on clicking another chart, make sure the marks are big enough to tap accurately.
Enlarged Tooltips on Mobile Devices
When tapping on a mark, a tooltip will appear with detailed information about that data point. On mobile devices, this tooltip comes with enlarged buttons on the bottom. The bigger tooltip box can obscure other data as shown below.
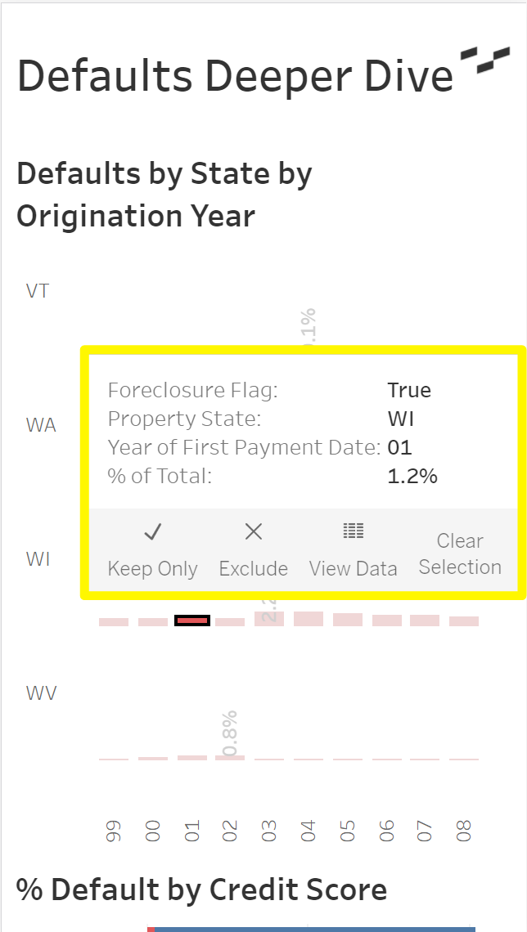
Above: A tooltip on a mobile screen.
Test your dashboard to see if important contextual information could be hidden under a tooltip. If so, you have a few options:
- Reduce the amount of detail in the tooltip
- Uncheck Include command buttons in the tooltip editor to save space
- Remove tooltips altogether by deleting everything in the tooltip editor
Note: Tableau announced plans to change this behavior at the annual conference in 2016.
Touch Screens Can’t Distinguish Between “Hover” and “Click”
Other than size, there’s another reason you may want to eliminate tooltips in mobile views. On a laptop or desktop, hovering your mouse makes the tooltip appear. Touch screens require a tap to see it. But, tapping a mark may also drive a filter or highlight action. Doing both in one tap could frustrate users.
Scrolling Sheets vs. Scrolling the Dashboard
A common way to get around limited screen space is to stack charts in a long, scrollable dashboard. Sometimes that can cause other problems. If one worksheet has its own scrollbar, users would have to scroll to the very end of that section before getting to the next. The example below shows a sheet with bar charts for every state. It’s difficult to scroll to get to the section below without swiping through all 50 rows.
Maps can also make it hard to scroll. Instead of scrolling, a thumb swipe on a map draws a selection box or pans the view. You can avoid this by turning off pan/zoom controls and floating a blank box over the top of the map to disable selection boxes.
Testing the Design
In Tableau Desktop, the Device Preview screen simulates screen size but does not fully simulate the mobile user experience. It will not show how tooltips and filter controls look on the selected device. It also won’t show the space used by a mobile web browser.
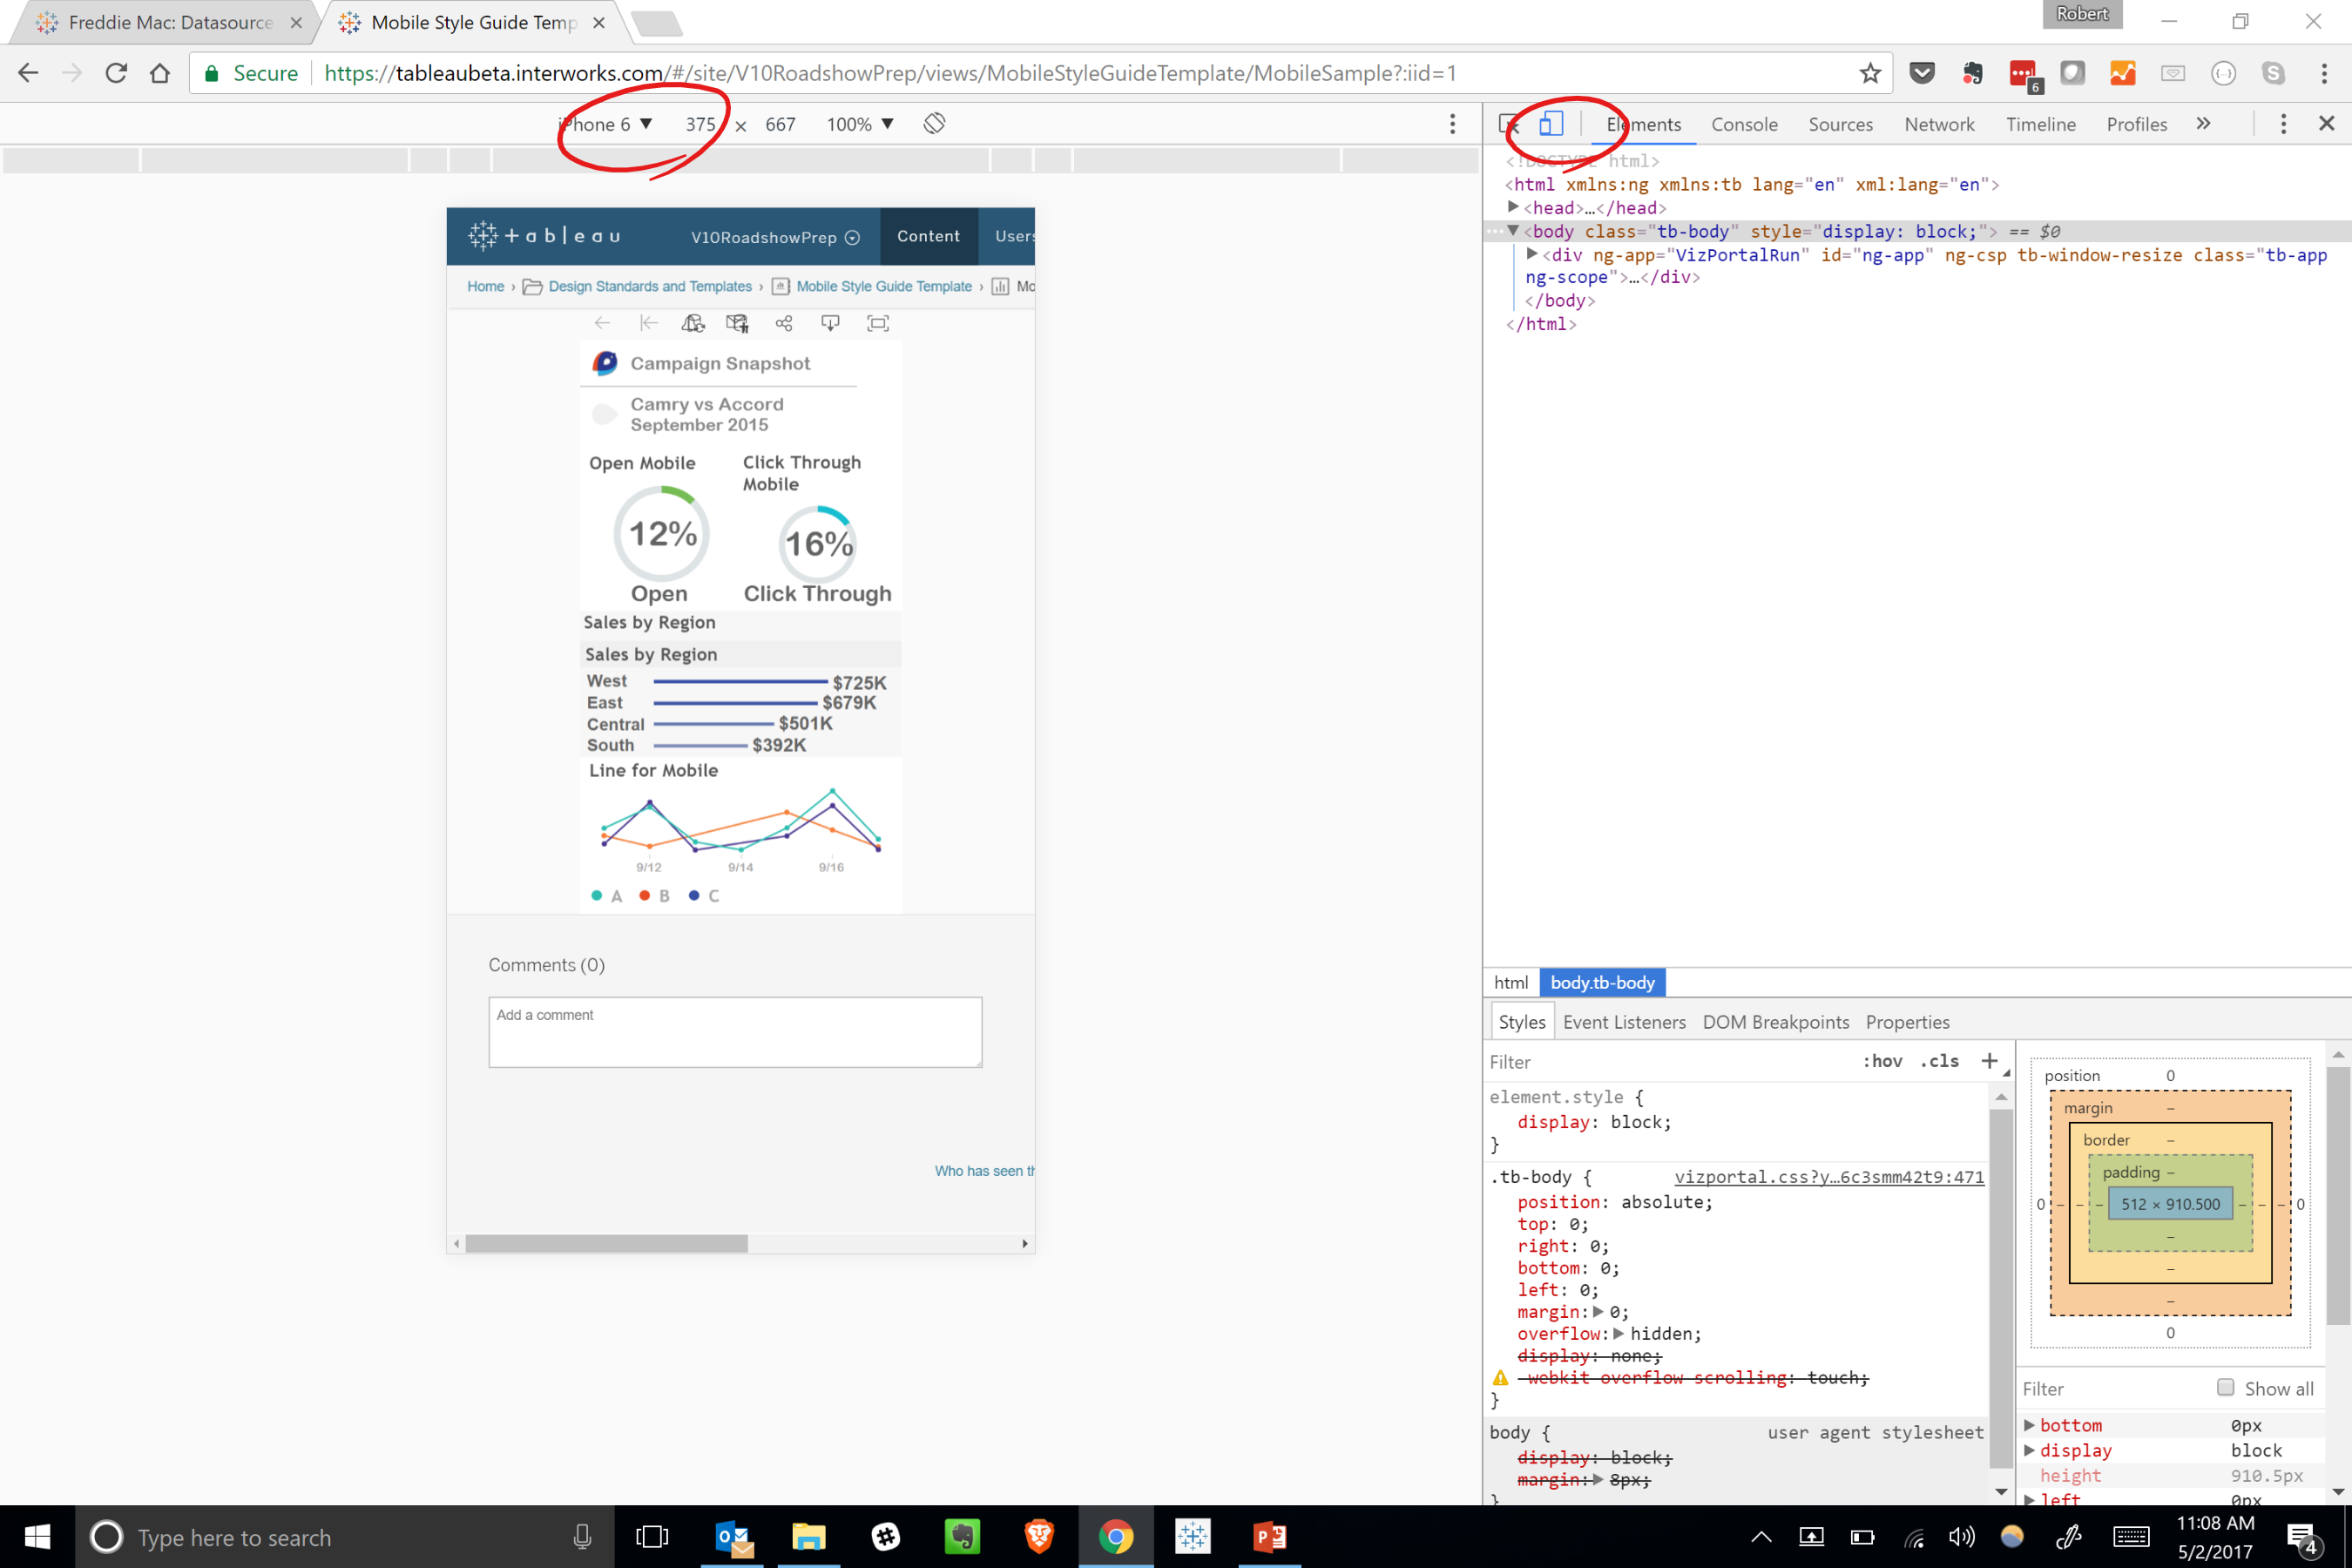
The best way to test a mobile design is on the device itself. But, if you you’re like most of us and don’t have multiple tablets and smart phones laying around, you’ll need a different option. Here’s how you can simulate mobile browsing using tools built into Google Chrome:
- Navigate to the dashboard you want to test
- Hit F12 to open Chrome Developer Tools
- Click the Show Device Toolbar icon in the upper left corner of the dev tools panel
- Pick a device to test
- Refresh the page (F5) to load the dashboard page as if it were on that device
By following the tips above, you’re well on your way to improving the user experience for people who need dashboards away from the office and on the go!