
Data stories are about people. We make charts about customers buying things, students earning grades, investors placing trades and on it goes. The people reading and making charts also have stories to tell, but their experiences are hard to describe with numbers and simple shapes. For that, we need something else.
The characters in this story are familiar: the manager who hides bad results, the decision maker who ignores facts and the analyst who knows the truth but won’t say it out loud. There are heroes, villains and everyone between. It sounds like something from a comic book, doesn’t it?
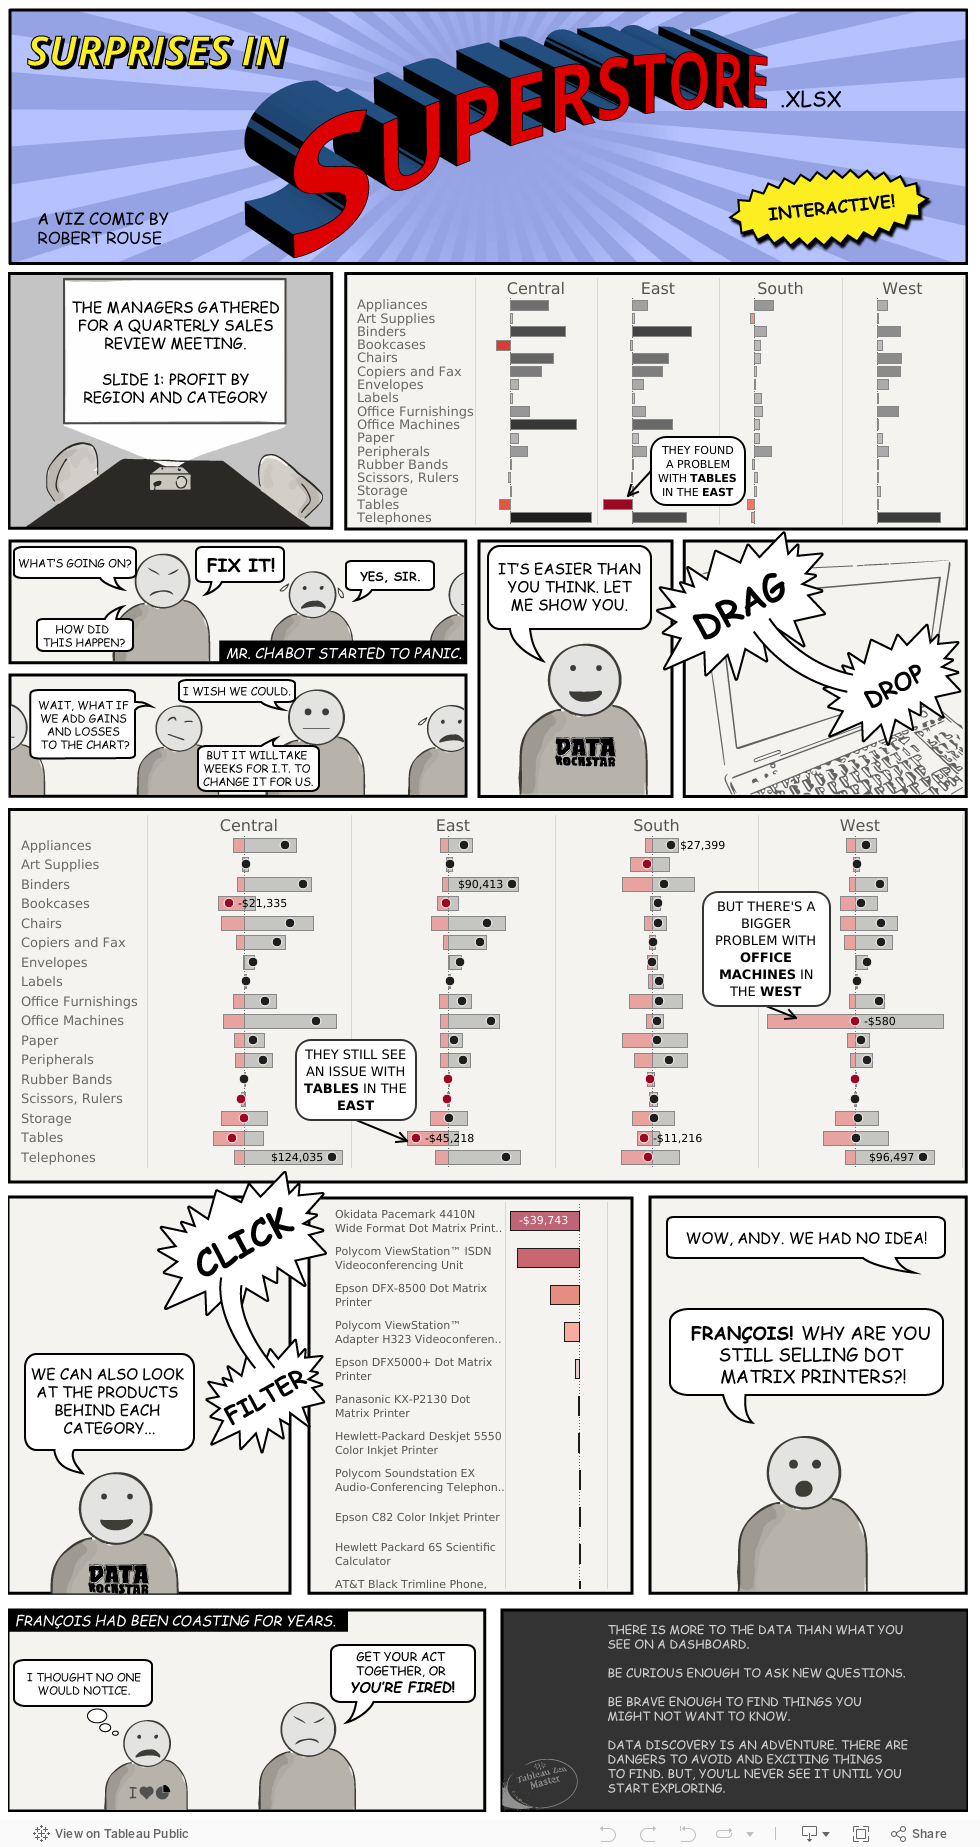
Comics are a good way to tell stories about people, but we can also use them to tell data stories. Or, we can do both at once with what I call a “viz comic.” Here’s my first one about people at a fictional office supply superstore talking about a routine report.
The Inspiration
The idea for this came from a keynote by Nick Sousanis, a comic artist and educator, during this year’s Tapestry Conference. After his talk, he asked us to draw our day on a sheet of paper using grids and gestures. This exercise proved a point he made earlier: that the act of drawing helps us see things in new ways.
One of his slides was an excerpt from a piece he co-authored for the journal Nature called The Fragile Framework. It seamlessly wove charts into drawings talking about the people, data and science surrounding the Paris climate talks in 2015. That gave me the idea to use a comic to make a point about data discovery.
In my last post, I talked about ways of thinking about data and avoiding biases. One of the best things you can do is realize that there’s more to the data than what you see. If drawing could help us see it from a different angle, as Nick argued, maybe it could help others see my point in a different way.
The Superstore comic is about people, not the systems of thinking I described in my earlier post. You work with people like that. You can imagine yourself in that situation, having that conversation. I hope it has warmed your imagination.
Now, imagine the people behind the real data you handle daily. Talk to them. Find their story. Get you paper and pencil ready.