Data visualization enables fast, intuitive analytics, but it can easily fool us. Experts routinely point out how bad visualization choices imply false conclusions. But, there are other cognitive biases at play beyond visual encoding. Choices about what questions to ask and what answers to display will steer related decisions. In this post, I’ll show how this can play out in a common business scenario and the traps to watch out for.
A Simple Scenario
Let’s say you’re the regional manager in the East region for an office supply superstore. In a routine sales review meeting, you see a dashboard on the screen like the one below showing profit by region and product sub-category:
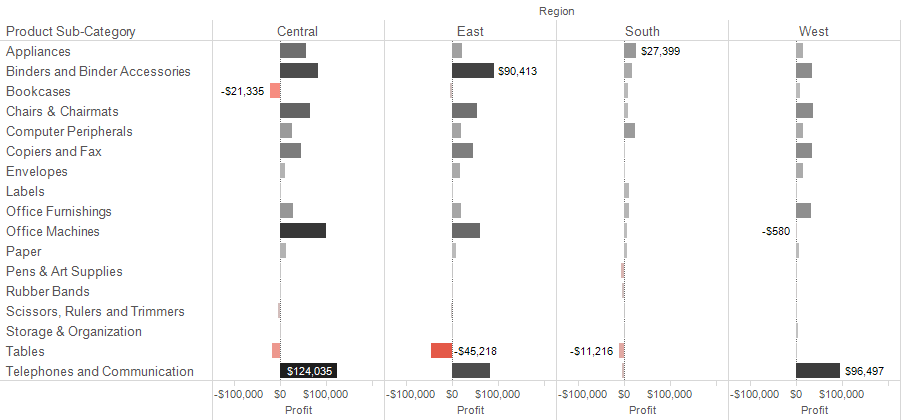
Some questions naturally follow: “What’s going on with Tables in the East?” “What can we do to correct these losses?” The dashboard designer anticipated this question and provided the ability to drill down and see which tables are the worst performers. The meeting adjourns and you begin to develop a mitigation plan prior to the next meeting.
Now, imagine that same meeting with a slightly different dashboard. This one contains the same profit numbers as before but with additional marks showing gains and losses along with the net total for each region and sub-category.
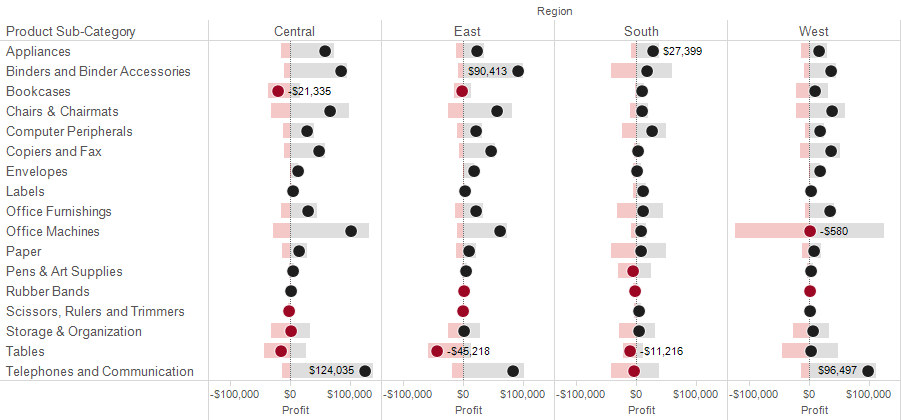
Do you see how this simple change would have redirected the follow-up inquiry from Tables in the East region to Office Machines in the West region? Without this view, would anyone have thought to look into that category as an area of opportunity?
A simple choice to look at things in a different way can steer analysis and decision-making in very different directions. What leads us to make (or not make) those choices?
Systems of Thinking
I recently read a fascinating book that illuminates the thought processes behind examples like the one above. In Thinking, Fast and Slow, Daniel Kahneman summarizes two modes of thinking this way:
- System 1 operates automatically and quickly, with little or no effort and no sense of voluntary control.
- System 2 allocates attention to the effortful mental activities that demand it, including complex computations.
Kahneman later explains that System 2 is often influenced by System 1. We can see this effect in the Superstore example where the follow-up questions change considerably based on initial conclusions.
Fast Visual Analytics
Some key components of visual analytics are: color, shape, size and position. These are called “pre-attentive” attributes because our mind can make visual comparisons before a conscious thought arrives. The pre-attentive mode goes with System 1 thinking.
Our hypothetical sales review meeting shows how initial perceptions affect the slower, more analytical follow-up. The bold red, the size of the bar and the position of the bar practically begged everyone to think about “Tables in the East” first. Several cognitive biases prevented the urge to look outside of that category. Here’s a summary of those influences in my own words using ideas from Kahneman’s book:
- What you see is all there is (WYSATI): We often arrive at conclusions based only on the evidence in front of us. Our dashboard shows sub-categories, so we are inclined to think about the data only at that level. We are less inclined to think about it at the product level, which reveals significant losses otherwise hidden.
- Cognitive ease: If it takes to much effort to change the data display and ask a slightly different question, few will do so. This is especially likely if the numbers look “reasonable.”
- Norms based on experience: It has become tribal knowledge among Tableau practitioners that “Tables in the East” is a poor performer and always has been (there are even t-shirts and games about it). This experience gives us little reason to doubt that conclusion when we see it again.
Good vs. Better
We rely on fast, intuitive conclusions because most of the time they work very well. It is rare to experience immediate negative consequences when using the same brain functions that alert us to physical danger. In our pretend sales meeting, fixing the situation with tables isn’t a bad idea. It leads to improved profits. However, we get far better results after learning that the store loses more money by selling unprofitable office machines (like dot matrix printers).
How do we ask better questions? We start by learning more about the biases that may lead us astray. Reading Thinking, Fast and Slow is a great place to start. Here are some other ideas to keep in mind:
- Ask yourself: “What am I missing here?” This will guard against the tendency to ignore details that aren’t immediately available.
- Make it easy to ask new questions. Deeper analysis doesn’t happen unless you can access and rearrange the data in view quickly as questions come to mind. My advice: make well-designed data sources accessible to business users via Tableau.
- Think beyond your own experience. We know and expect Tables to lose money in the East region, but always be on the lookout for alternate perspectives. Encourage open dialogue and collaborative analysis.
There are many more things to consider besides those in my simple example. Personalities, politics, or expertise can impact our idea of what’s “reasonable” enough to accept or argue. Therefore, developing a data-driven culture involves much more than simply making data available. We must learn to think properly about that data.