
I recently found a data set that was perfect for testing out the new Data Interpreter in Tableau 9.2. While discussions about Syrian refugees were ramping up, I sought out data about the situation, which led me to the UNHCR page dedicated to this crisis. Using the Excel download option at the top results in a file with five different sections on one spreadsheet. This post discusses how to use the new sub table detection feature in Tableau 9.2 to automatically recognize this structure and minimize manual data manipulation. For an overview of some other great new features found in Tableau 9.2, be sure to check out this article from my colleague, Katie Fontenot.
Let’s jump into our example.
Incoming Data Structure
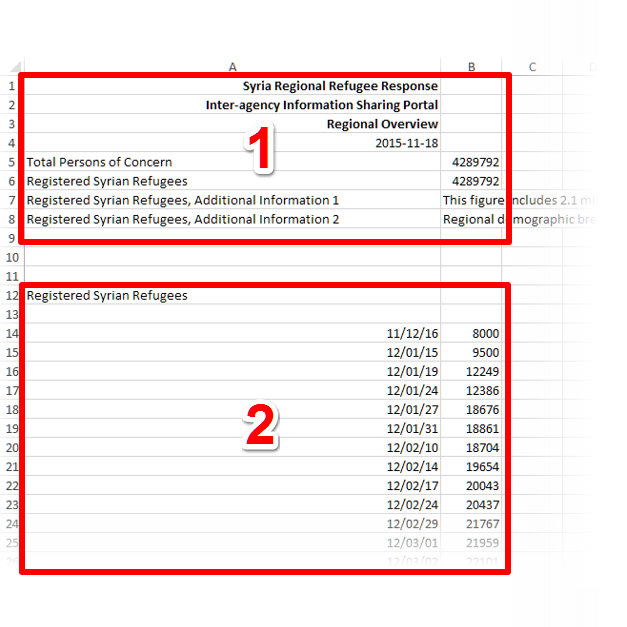
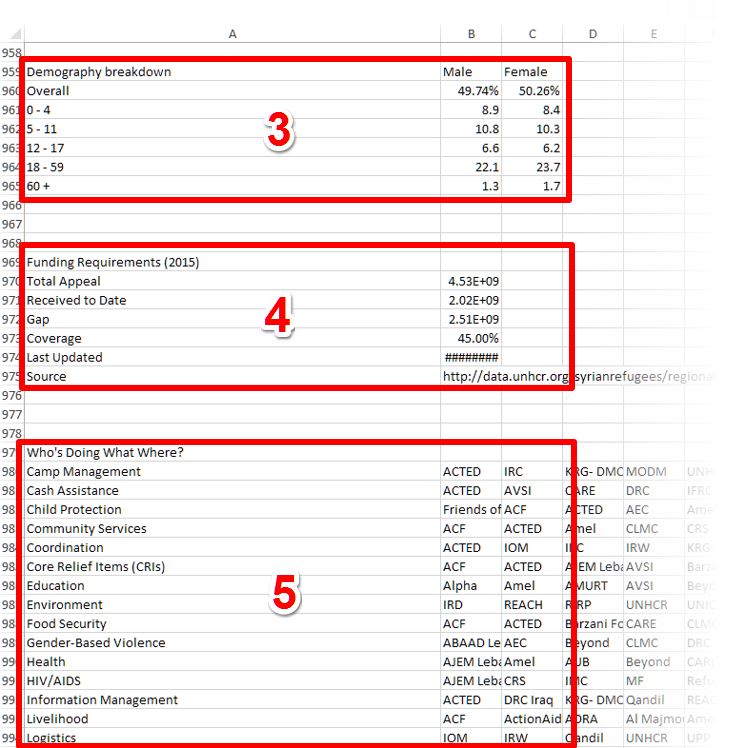
The downloaded sheet has five sections:
- Overall Summary
- Refugees over time
- Demography
- Funding Requirements
- Who’s Doing What Where?
These sections are highlighted in the screenshots below. As we can see, this is not a data structure that Tableau could automatically recognize in prior versions. Now, the Data Interpreter can automatically recognize each sub table:
Using the Data Interpreter
When connecting to an Excel file, Tableau initially shows the sheets in the workbook but does not immediately show sub tables in those sheets. Follow these steps to make them show in the Data window:
- Drag the sheet with sub tables into the top pane
- Turn on the Data Interpreter
- Any sub tables will appear and can be used like normal data tables
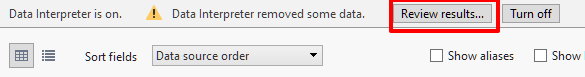
It is a good idea to verify that Tableau correctly interpreted the structure. One way is to preview each one using the data grid to quickly check the fields it found. Another more detailed way, is to use the Review Results button, especially when Tableau warns that it removed some data. This option exports and Excel file that color-codes how the Data Interpreter handled each part.
In the bottom section, I found it useful to pivot the fields to visually analyze the ways different organizations are helping. I was glad to see that Tableau allows users to pivot fields in the sub tables the same as other kinds of data tables.
No Need to Cut and Paste
That’s all there is to it. Before, we would have had to cut and paste each sub table into different sheets. Now, Tableau does the work for us. It does the work of splitting up parts of the spreadsheet so we don’t have to. While I have demonstrated this with refugee data, this structure exists everywhere people use Excel to organize data. If you haven’t already upgraded to Tableau 9.2, download it now to take advantage of this new time saving feature.