
With Tableau 8.2 now available, the InterWorks team wants to give you an in-depth look at some of our favorite new features. Our What’s New in Tableau 8.2 blog series covers these in detail. This post is the second post in the series. Check out the full list on our Tableau 8.2 blog channel.
The launch of Tableau 8.2 brings with it some major changes to its mapping functionality. The biggest differences users will find include faster performance, a sharper image and the ability to see an even greater level of detail.
Performance
With the Tableau 8.2 update, Tableau has brought all of its mapping services onto its own servers. This means faster load times on maps and faster functionality when interacting with maps. Instead of rendering the entire map every time you zoom in or out, the new maps only send the individual tiles that are needed to render that particular view. You will see far fewer blank screens while waiting for a map to load or update after you have zoomed in or out. Additionally, marks are more responsive when you hover over a location on a map. The performance boost is significant.
Image
Just in time for Tableau’s ability to support Mac OS, the mapping update includes increased compatibility with high DPI displays – meaning charts will look great on Macs with Retina displays. The maps boast up to four times more pixels per tile as the previous map tiles. Tableau also collaborated with design experts Stamen Designs to produce some attractive new mapping styles.
Detail
Moving forward, Tableau will get its default map data from Open Street Map, thus enabling greater detail on map data around the world. Maps built using Tableau 8.2 will appear with the copyright of “OpenStreetMap contributors.”
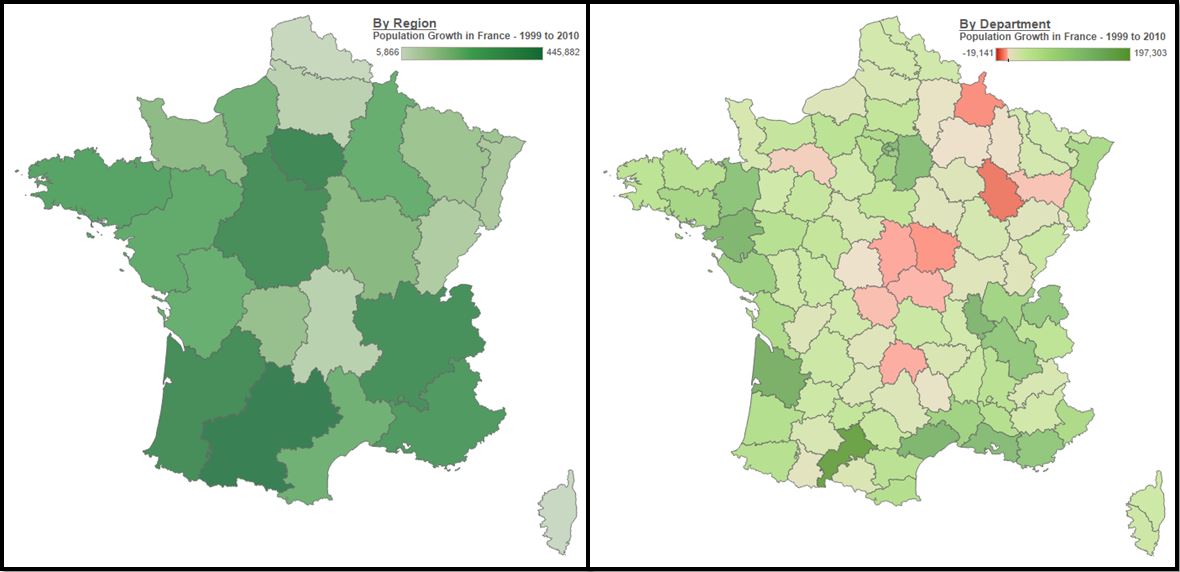
Tableau continued its efforts to provide users with greater detail at the country level by including geo data for French departments, Spanish provinces and UK county equivalents. Previously, the deepest you could go in these countries was the region level.
Example: The maps below show the population growth in France from 1999 to 2010. In Tableau 8.1 (left), the deepest you could view was at the regional level. With the launch of Tableau 8.2 (right), you can view it at the departmental level.
Learn More
Want to learn how to utilize the new Tableau 8.2 features in your business? InterWorks is the leading provider of Tableau consulting and training services. Let us know how we can help!