Note: This blog post builds on a previous post and was created in collaboration with analytics consultant Dave Sirey.
Set actions are opening up a new world of possibilities in Tableau.
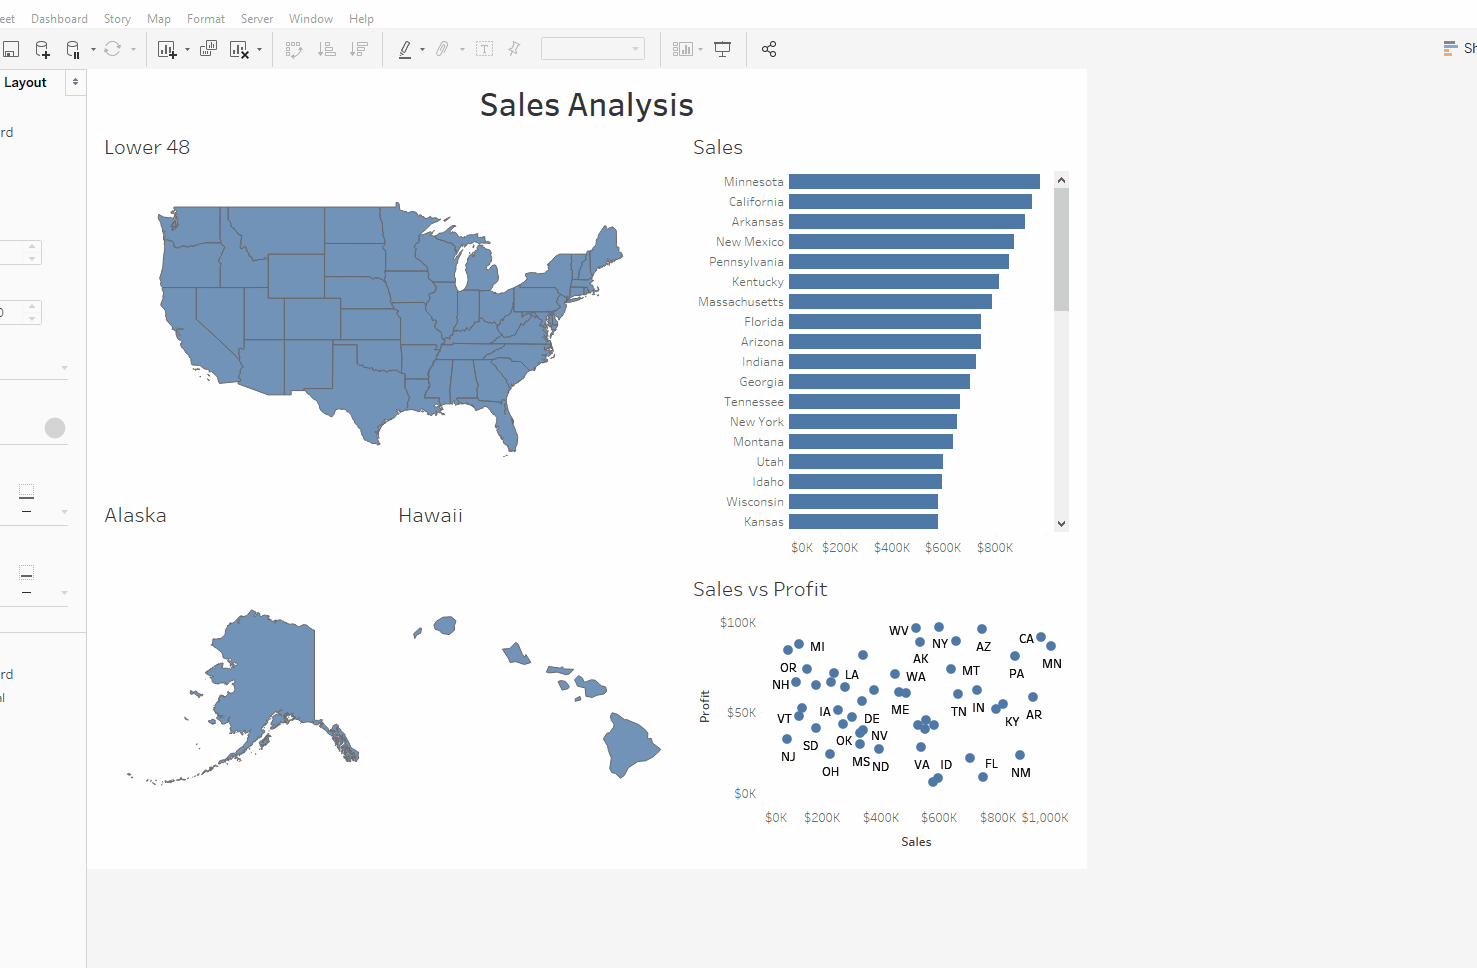
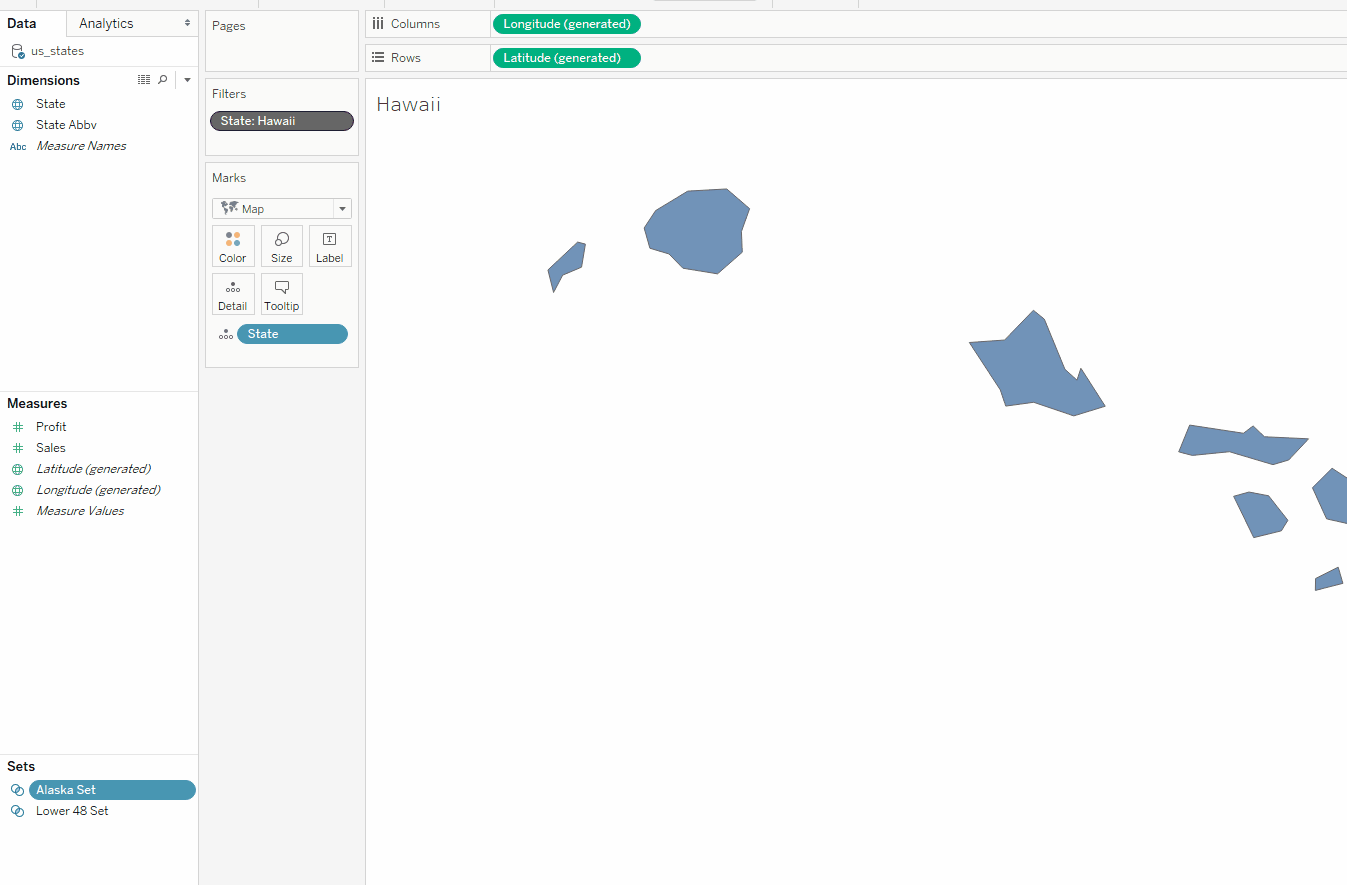
Recently, we tried tackling one of the common struggles in Tableau: visualizing geographic data with Alaska and Hawaii. Not only that, but we needed the added function of being able to filter data in order to compare across all 50 states. For example, we wanted to filter to see information from North Carolina, California and Alaska by selecting these states on the maps.
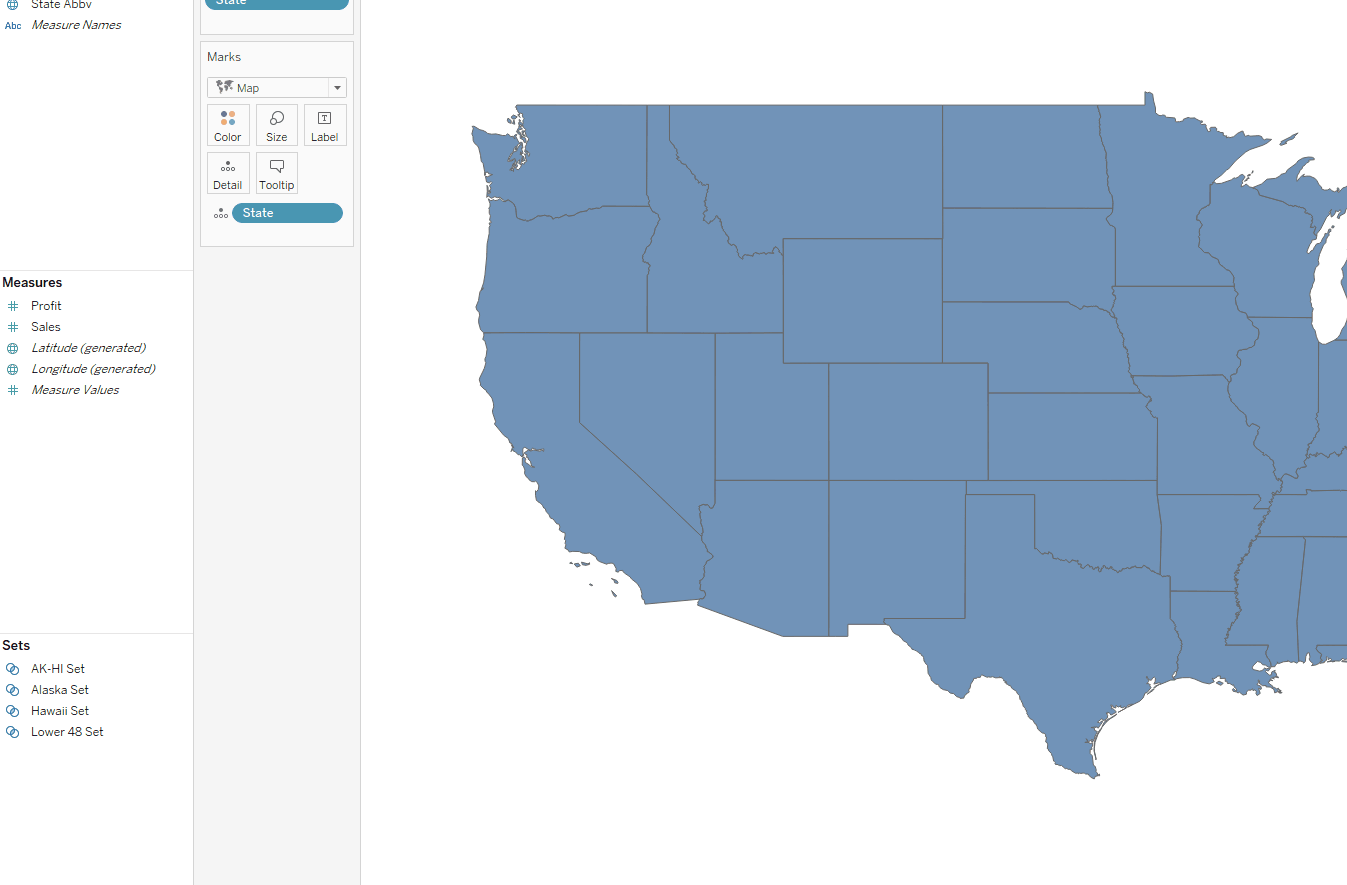
The most common way to display AK and HI in a viz is to put them on separate worksheets and put all these worksheets into a single dashboard. But as you can see from the viz below, this creates problems when we try to interact with all states at the same time:
Thanks to our new hero, set actions, we can select multiple states even across disparate worksheets. Here’s how:
Note: In this example, we are using a map; this technique will work with marks in any format as long as you want to filter using the same dimension.
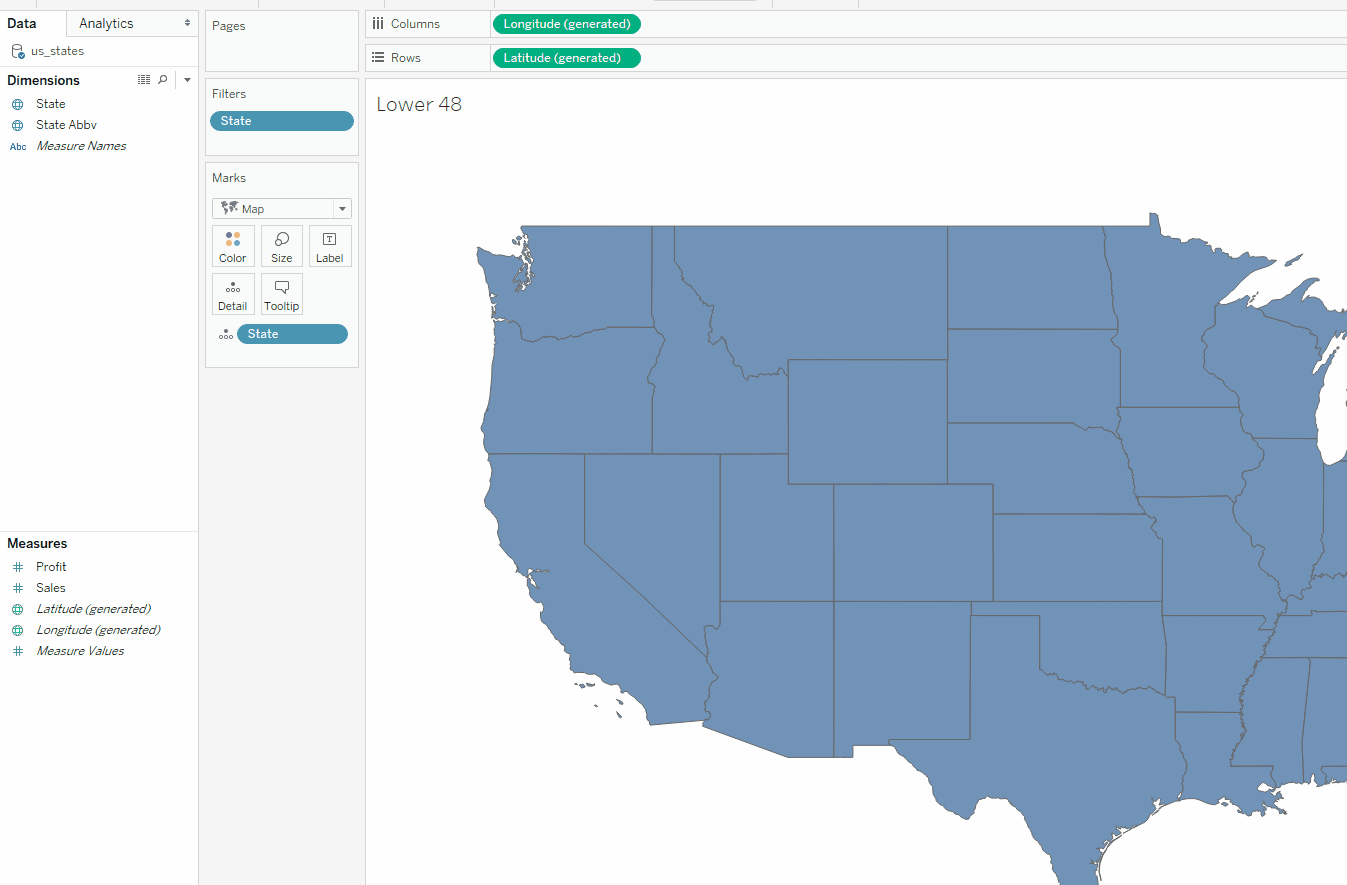
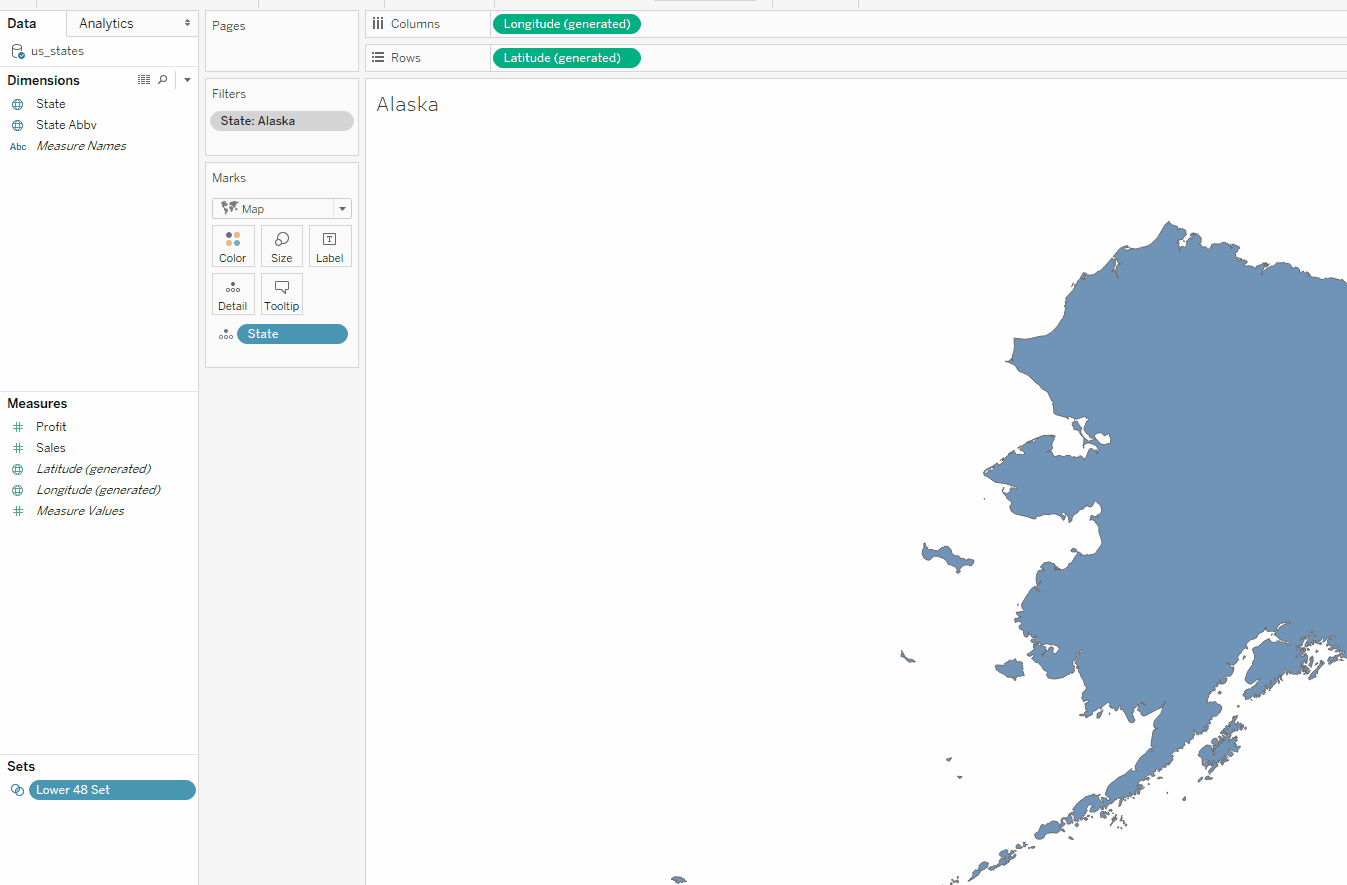
Step 1: Create a Set for Every Worksheet
Make sure you’re creating the set on the exact same dimension for every worksheet. If you used State on worksheet 1, make sure you use State on worksheet 2:
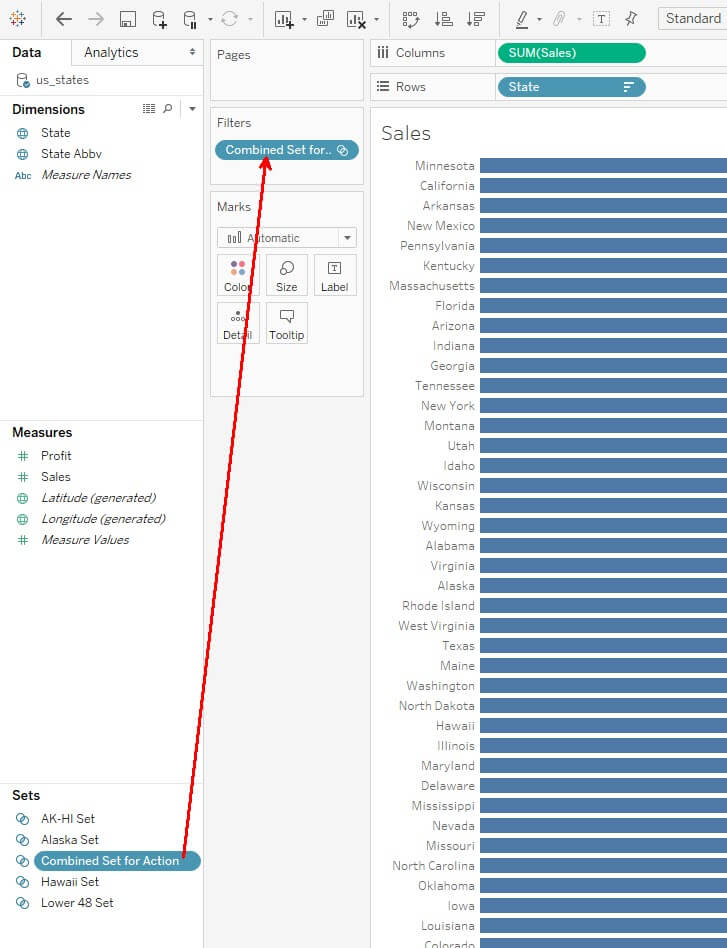
Step 2: Create Two Combined Sets
The first should combine the Alaska and Hawaii Set (named AK-HI Set here). The second set should combine the AK-HI Set and the Lower 48 Set. This second combined set we’ll call Combined Set for Action:

Step 3: Filter to Only See the States in the Combined Set
Move the Combined Set for Action to the filter card for each worksheet you want filtered. Here, that will be Sales and Sales vs Profit:
Step 4: Create Dashboard Actions to Change the Set Values
Add three dashboard actions for Change Set Values. Here, you want each worksheet to add to the set that you created for each of these sheets. In this example, we select the option Clearing the selection will: Remove all values from set. We do this so that the bar chart visualization will only populate once the user selects at least one state and will remove that state once it is deselected:
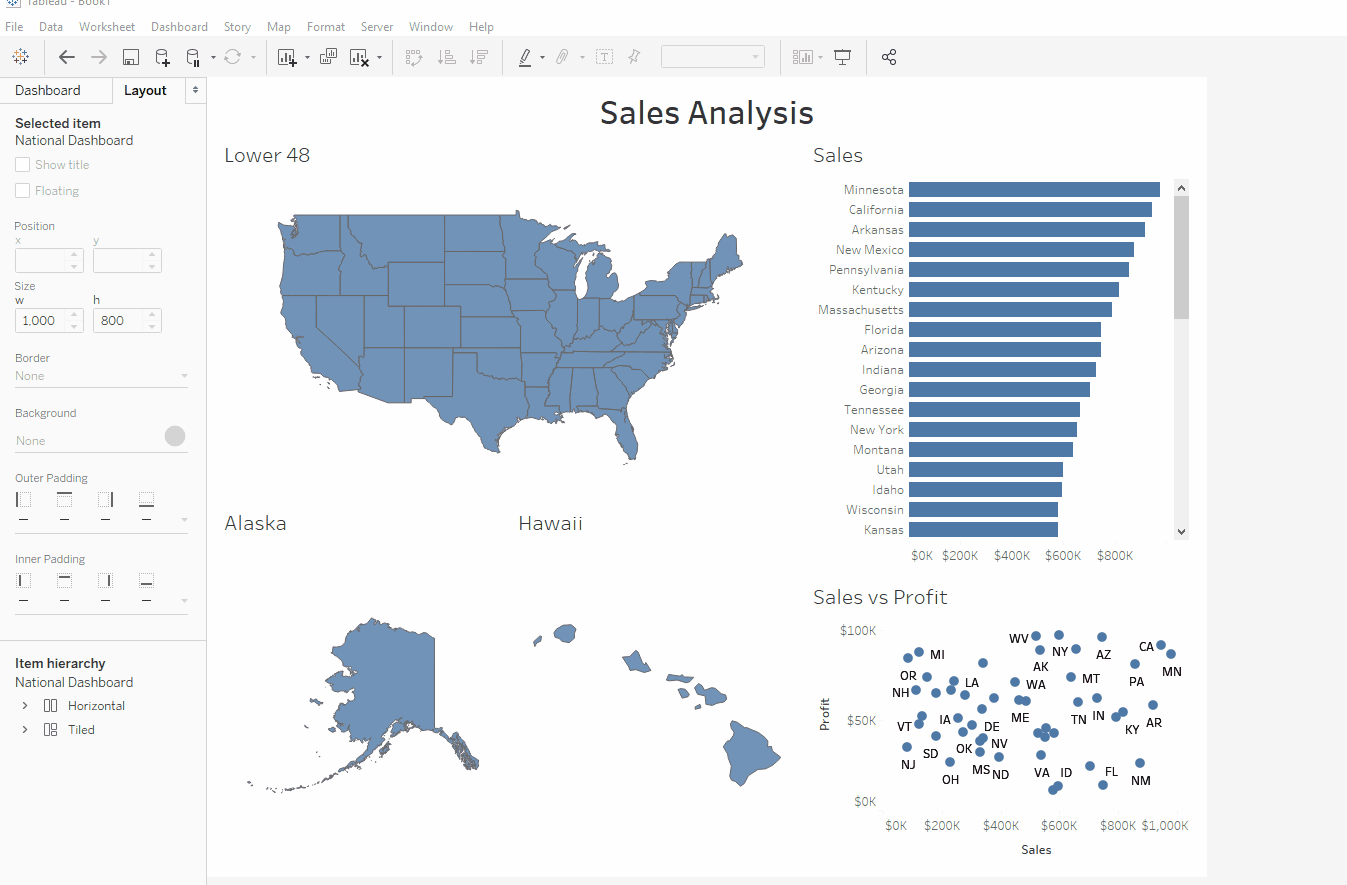
Step 5: Enjoy!
To clear the filters, click in each individual worksheet … then watch the magic happen!