
The Drawing Tool has been incorporated into CBI Studio by InterWorks. Explore CBI Studio to see what’s new.
“Cats.” “Wicked.” “The Lion King.” “Hamilton.” Whether you’re a Broadway aficionado or you can’t stand the idea of someone randomly breaking into song and dance to explain their hardships and feelings (which there is also a musical about), you can’t go through life without at least hearing about musicals. I fall into the former category.
Since I was a small child, my mother has been taking me to see local productions of Broadway musicals and then finally, when I was 13, to see an actual production on Broadway in NYC. It began a long love affair which has resulted in me watching the Tony Awards religiously every year from my couch while gorging myself on Chinese food and wine. After this most recent awards season, I became curious about the winners and the theatres they come from. Are there some theatres that had more nominees than others? How about more winners than others?
Data Generation
While I may love watching the Tony Awards, I do not have all the nominees and winners memorized. Yet. Thankfully, Wikipedia has all this information stored for me. Using IMPORTHTML within Google Sheets, I can scrape the tables for every Tony Award since the first in 1947. My colleague, Raphael Teufel, recently created a dashboard and blog explaining the technique. However, there have been 71 Tony Awards. That’s quite a lot. To make this visualization a little less cluttered, I decided to visualize just the past 20 years and only look at five awards:
- Best Musical
- Best Actor
- Best Featured Actor
- Best Actress
- Best Featured Actress
Data Visualization
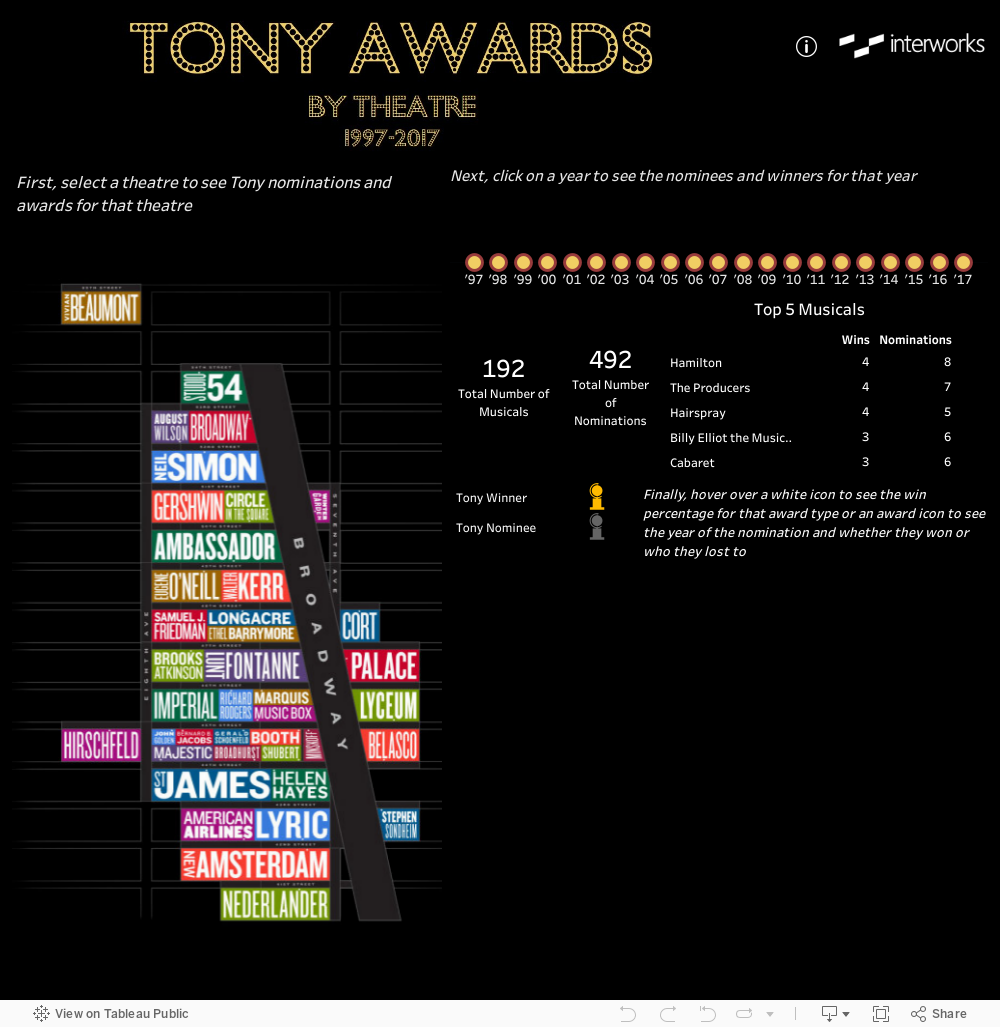
Being a more visual person, I wanted to be able to see the theatres on a map as opposed to just a list. Using the InterWorks’ Drawing Tool for Tableau, I was able to take an image of all Broadway’s theatres and create a custom polygon for each one. This a great way to make images clickable. Now, when you select a particular theater, you can filter the dashboard to only see the shows and awards pertaining to that theater. Now we’re displaying the theaters in a more interesting, visual way.
For example, when selecting the Gershwin Theatre, we can see that the timeline in the upper-right hand corner has changed. It is now showing the years that shows at the Gershwin Theatre were nominated for Tony awards. Interestingly, while there were five shows nominated within a seven-year span, the Gershwin has not had a nomination since 2004. This is because “Wicked” has been at the Gershwin for the past 14 years.
Enjoy exploring the world of the theatre and the Tony Awards! If this sparks an interest to you, I’ll see you in June for the 2018 Tony Awards. You bring the Chinese food, I’ll bring the wine.