
A look at effectively preparing for the rapid aging of the American workforce utilizing calculated fields and parameters in Tableau.
The Scenario
It’s no secret: The American workforce is aging – rapidly. The “Silver Tsunami” is hastily approaching land. With it comes waves of increased medical expenditures, inflated salaries and, eventually, the retirement of all those years of experience the Baby Boomers have accrued.
Even the Average Joe probably has at least a cursory familiarity with this phenomenon – be it from that Business 101 course during their freshman year or a first-hand account of 30 years of tenure being wiped out from under them in the form of an “early-retirement” riptide. But, many are still without a sound understanding of just how dire the potential consequences are.
Though companies big and small are bailing water from their proverbial life rafts in the form of downsizing or incentivizing early retirement, this model inevitably becomes ineffective. This leaves a firm with either a young, inexperienced and underqualified workforce or forces them to rehire their former employees on a contractual basis at a premium. Coupled with the fact that many Americans nearing or past retirement age are being forced to work considerably longer due to being left with a fraction of their retirement funds post-recession, the situation is compounding exponentially.
For your local Mom and Pop shop, tracking all these Boomers maybe not be that difficult – everyone knows Stanley in Accounting has a “Days ‘Til Retirement” clock in his cubicle. However, for a major corporation of 10,000 or more employees in multiple office locations around the country, this task might prove to be a major undertaking.
The Task
You’re tasked with effectively portraying vital information surrounding the percentage of your company’s employees nearing retirement age. How do you go about isolating this population group from a data set consisting of countless rows explicitly stating each employee’s individual transactions? For the novice query writer, you may find yourself attempting something like this:
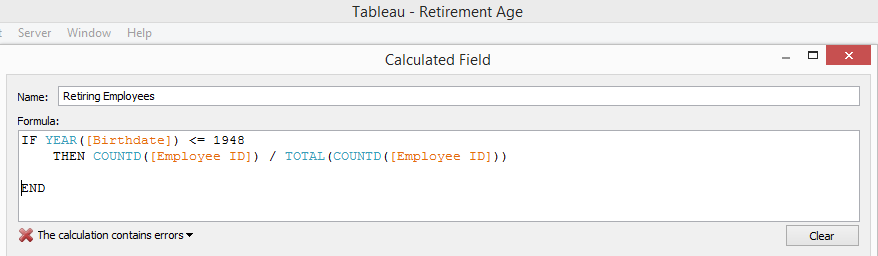
Why won’t this work? It is fairly clear what you are trying to say here, and you’re on the right track, but Tableau seems to disagree.
The issue in this scenario lies in the mixture of aggregated and non-aggregated fields, the date field we use to determine an employee’s date of birth in this case being the pesky little non-aggregated comparison.
The Solution
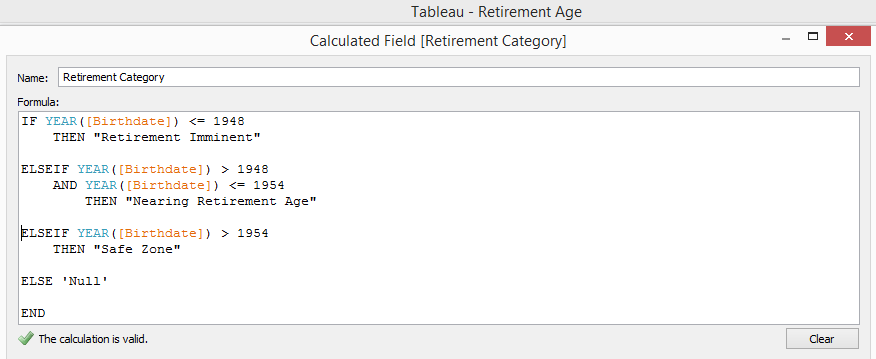
In order to return what we are aiming for, we’ll need to break this into two calculated fields. In this case, we want to return the portion of employees that have a birth year suggesting they are at or near retirement age. For simplicity’s sake, we’ll set this at the age of 66. But, for reference, this is a sliding scale. See the link below.
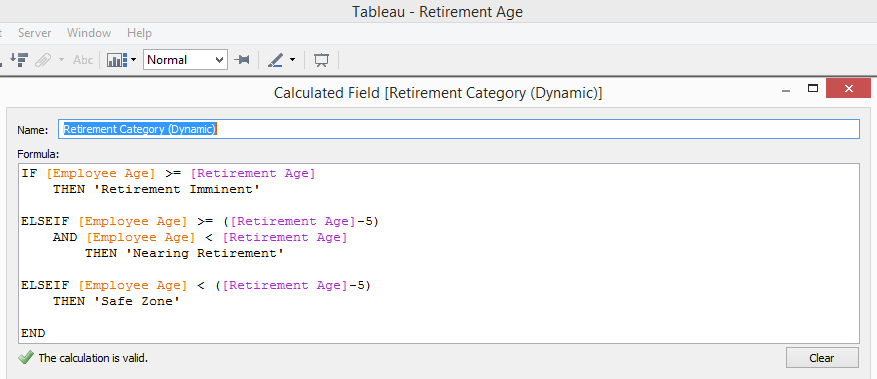
For the first calculation, let’s break the employee into population into logical groups:
To then display the number of employees that fall into each of these bins, we can then do a quick table calculation showing the percentage of total number of records by Retirement Category.
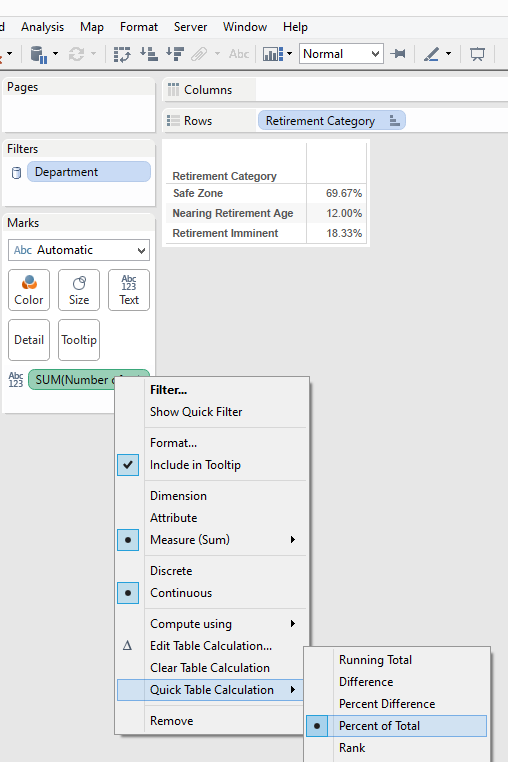
Okay, great! We now have a flat calculation that tells us how many of our employees fall within each of these categories this year. From here, we can then create any number of visualizations that utilize these numbers and paint a pretty picture. But, what if the boss wants to see what will happen next year? The year after? Better yet, what if he or she wants the retirement age to be a sliding scale?
Back to the drawing board.
The Better Solution
Creating a dynamic dashboard that effectively visualizes not only the here and now but also allows the end user to customize the visualization without manipulating individual fields requires the utilization of one of Tableau’s most powerful features: parameters.
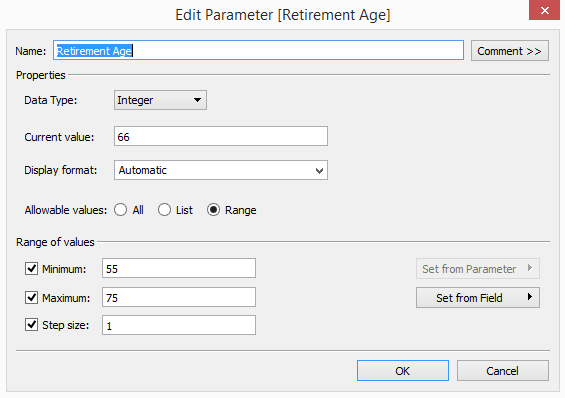
Let’s start with Retirement Age. Remember how the boss wanted to manipulate the set age at which his employees retire? Using a parameter, we can make this a sliding scale that allows them to pick an age of their choosing and instantly view how it affects the breakdown of employees.
In this case, we want use a set range of 55-75, displayed as an Integer, with the ability to filter by each individual age within the range (step size). That should look something like this:
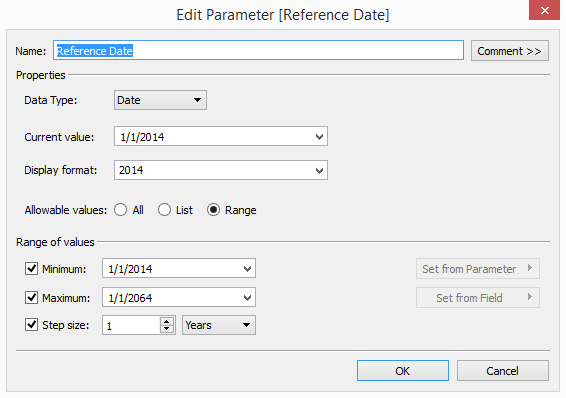
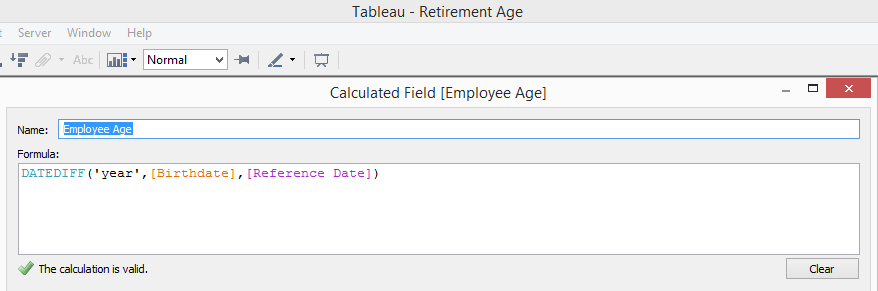
Next, we’ll need to define Employee Age in a way that can communicate with this parameter. We have each employee’s birth date on file, but that does not inherently tell us how old that person is relative to today. For that, we’ll need to use the DATEDIFF function. Before we do that, let’s consider that the boss also wants to be able to manipulate the Reference Date from which he or she views this date. Certainly he or she would want an employee’s age to be relative to this date as well. How do we accomplish this? Time for another parameter.
Using a parameter based on a Date, we can create a dynamic filter which will allow the boss to choose a reference point from any point in time. For this example, we’ll set a date range of 50 years from each Fiscal Year rollover. To avoid getting bogged down in too many variables, let’s set the step size at one year and create a custom display only showing the Fiscal Year (Display format: yyyy).
We are now ready to tackle defining an employee’s age. Using a DATEDIFF calculation will allow us to portray any employee with a birth date on record as an integer relative to a specific point in time. In this case, we just created our Reference Date. It will look something like this:
Now we’re getting somewhere. Utilizing these dynamic fields we’ve created, let’s retry that Retirement Category grouping.
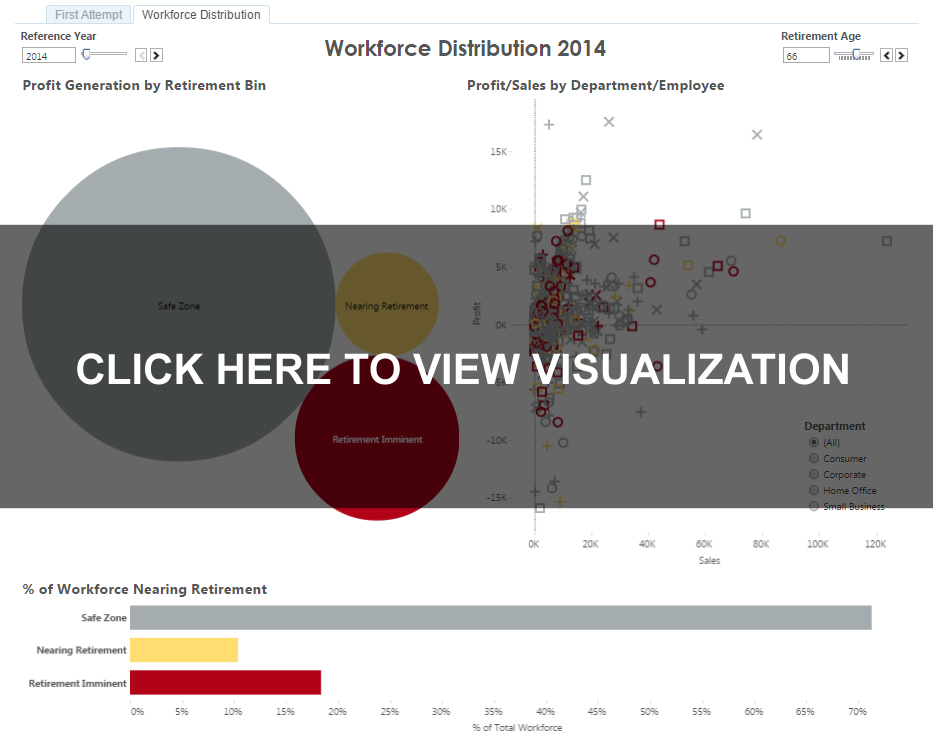
The end result gives us a platform to create some compelling visualizations, highlighting the percentage of our company’s workforce that will be riding the retirement wave off into the sunset. Click on the image below to interact with the visualization:
Reference
U.S. Retirement Age: http://www.ssa.gov/retire2/retirechart.htm