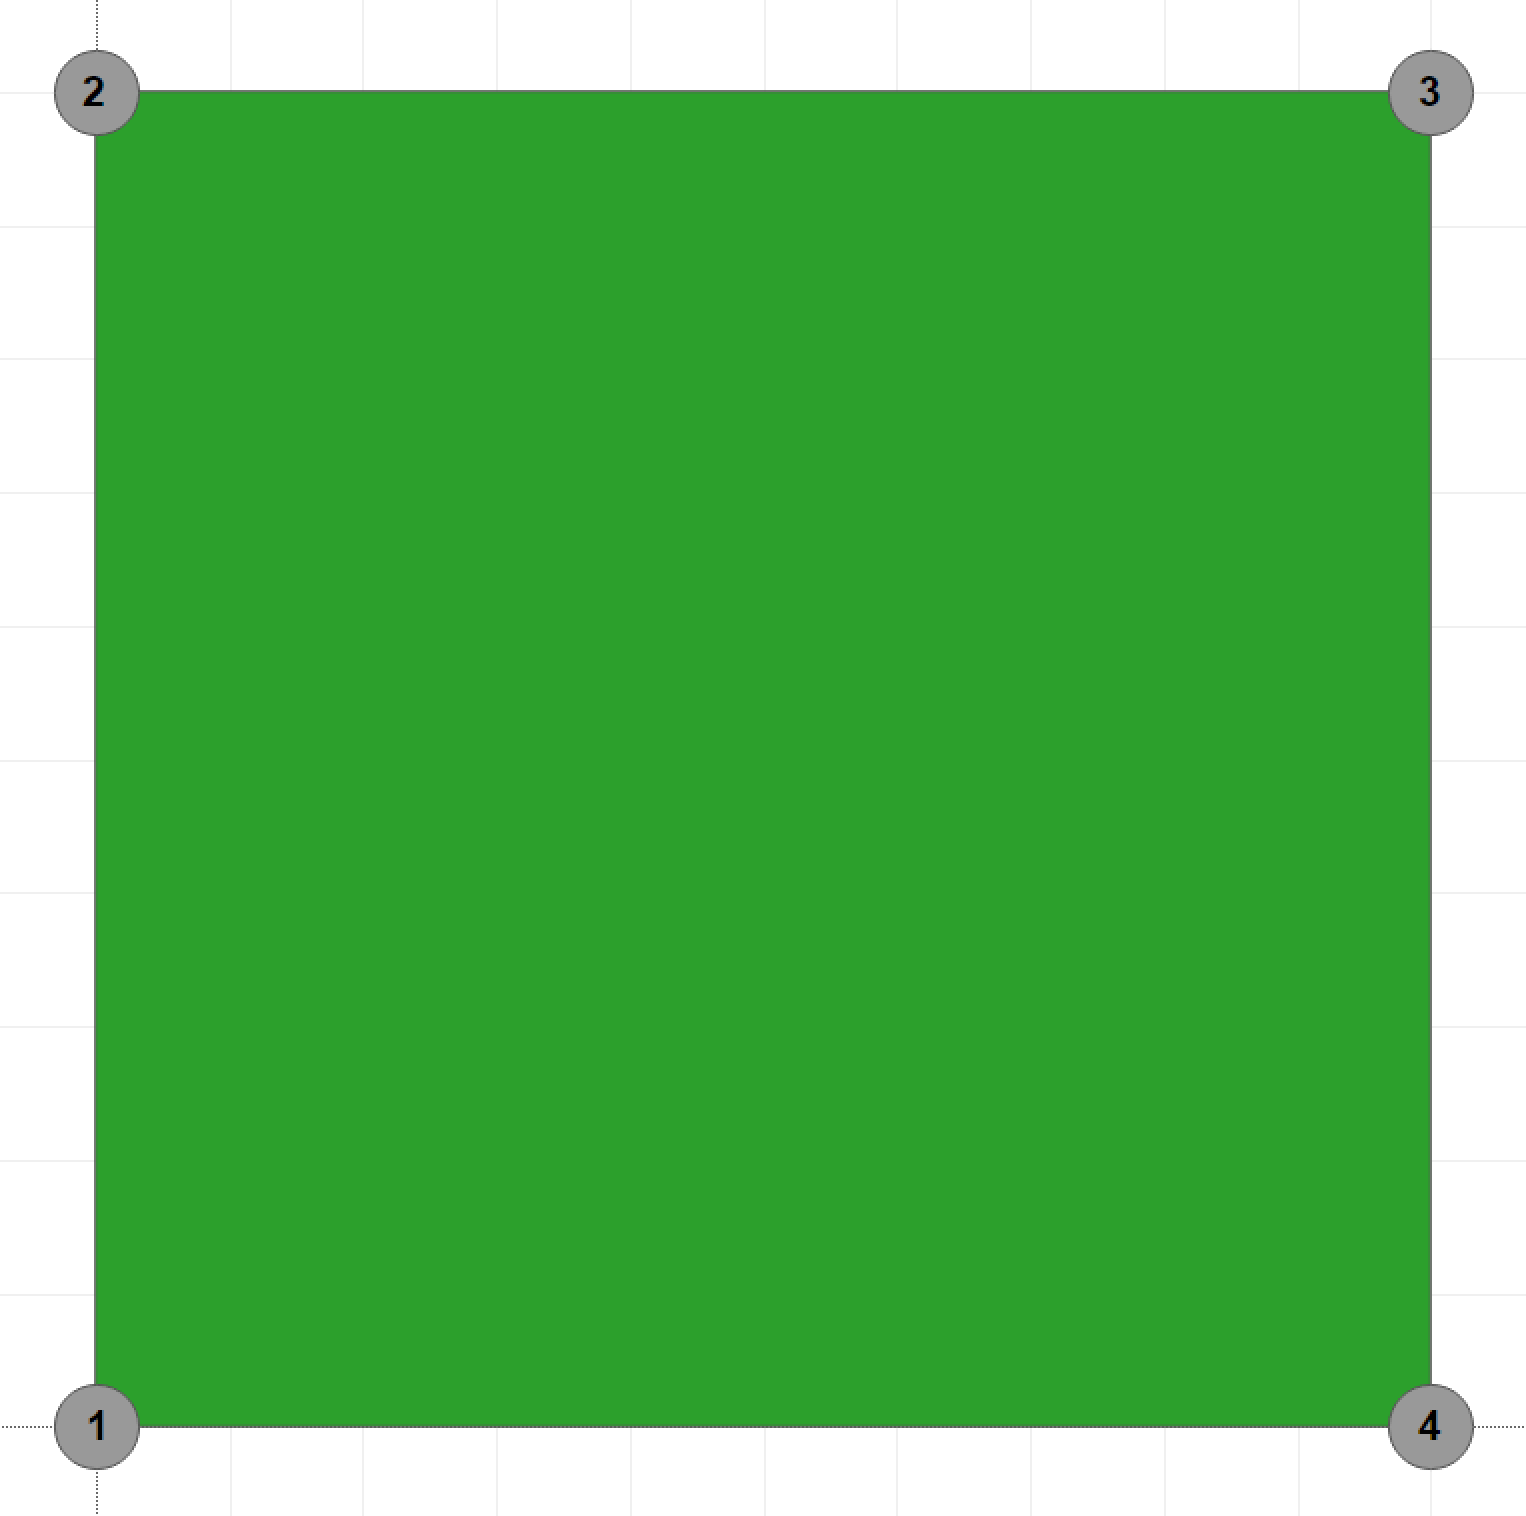
In Part 2 we simulated a Marimekko using stacked bars but since the boundary for each element / polygon of a Marimekko in Tableau is made up from 4 Cartesian Coordinates we are going to use scales of 0 – 100 % for both X and Y axis and plot each corner of the polygon accordingly. This means that we will need a to calculate different values for various Points (1-4) for any given X or Y Dimension. We can use logical IF and CASE statements in our calculated fields to achieve this. Please note that [Point] should be dragged to Dimensions in the data window.
[X Axis]:
IF ATTR([Point]) = 3
THEN PREVIOUS_VALUE(0) + [X%]
ELSE PREVIOUS_VALUE(0)
END
DTC > Compute Using: Advanced > Addressing: X Dimension, Point; Sort: Automatic
[Y Axis]
ZN(PREVIOUS_VALUE(0)+
CASE ATTR([Point])
WHEN 1 THEN ZN(LOOKUP([% of Y within X],-1))
WHEN 2 THEN [% of Y within X]
WHEN 3 THEN 0
WHEN 4 THEN [% of Y within X]*-1
END)
DTC > Compute Using: Advanced > Addressing: Y Dimension, Point; Sort: Sum of Sales Decending.
Dimension, Point; Sort: Sum of Sales Decending.
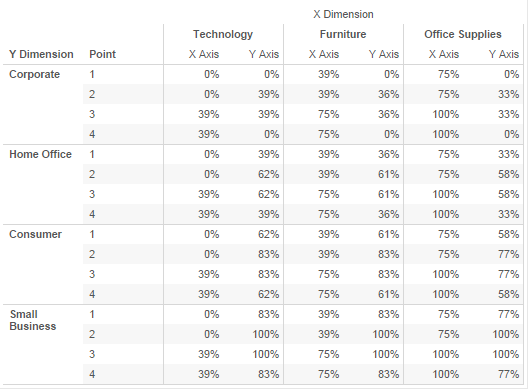
When dealing with complicated table calculations it is best to start with a table of data, that way you can get a feel for what the calculations are really doing and make sure there are no mistakes before you create your viz. In the Crosstab above I have put [X-Dimension] in to columns, [Y Dimension] and [Point] in to Rows. I then drag [X Axis] in to the workspace followed by [Y Axis] to make use of measure names / measure values. Lastly I sorted the dimensions to make sure that they appeared in the same order as my table calculations.
In the X Axis calculation above we are putting the previous value in for points 1 and 2 (or Zero if there is no previous value) we are then incrementing the value for point 3, it is behaving as a running sum for each Y Dimension along the X Dimension but only incrementing at point 3 (this means that point 4 will be the same as point 3 for each X Dimension. The value of the increment is calculated using [X%] as described earlier in the blog series.
The Y Axis calculation is a little more complicated as the values are not common to each Y Dimension but run along the Y Dimension (and Point). It restarts for each X Dimension calculating the result from the previous value along the Y Dimension and Point.
If you understood that on your first read then you are doing very well. The table above illustrates how the results should look and may be easier to digest.
In Part 4 we will be putting these calculated fields in to a Mekko.