In Part 1 we learned how to use custom SQL to shape our data ready for use later on in polygons. In this part we will use parameters to allow dashboard viewers to exchange dimensions. This methodology can be applied to any chart type which is sliced by a dimension and is a great alternative to replicating many similar dashboards.
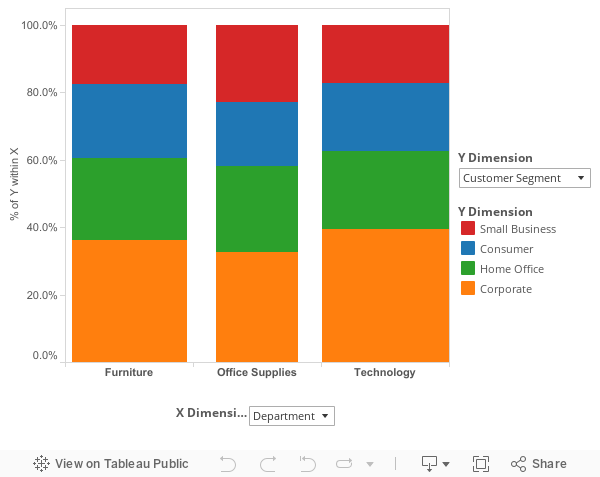
Although Tableau doesn’t have a Marimekko built in, a great adaptation is a Variable width bar chart, this will enable us to set up the parameters and to start creating some of the table calculations ready for our Mekko later. Much like a Marimekko, the variable width bar chart represents the % of total for each X Dimension as the width of the bar; it then shows the % of the Y dimension within each X dimension to give an impression of the overall % of any one element.
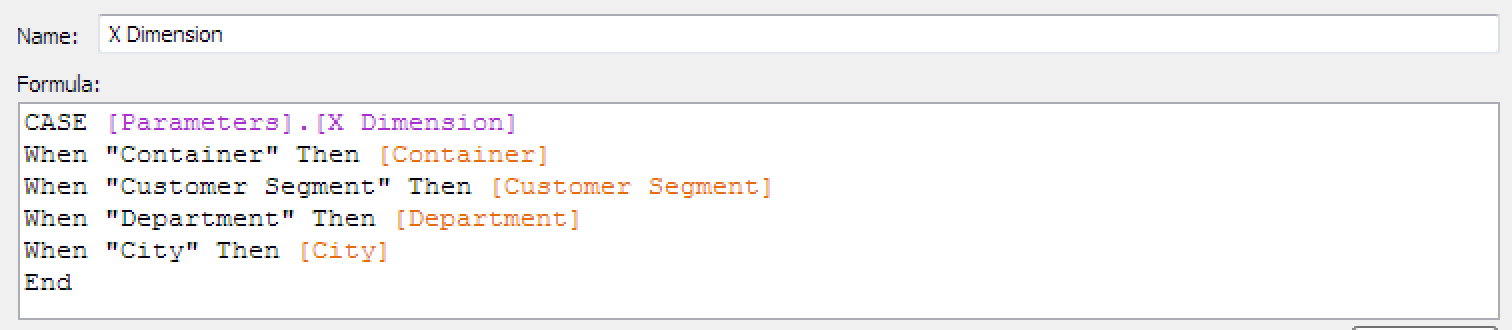
A parameter only works in conjunction with something else (in this case a calculated field) We shall therefore create 2 parameters called “X Dimension” and “Y Dimension” and 2 calculated fields also called [X Dimension] and [Y Dimension]. Each parameter will refer to the names of the Dimensions to be selected between.

Each calculated field will refer to the corresponding parameter.
We will also create 2 calculated fields for the width of the bars [X%] and the percentage share within each bar [% of Y within X]. The 2 calculated fields are table calculations rather than standard calculated fields. The important thing about these table-calculated fields is that they run in a certain direction; this can be pre-defined in the blue ‘Define Table Calculation’ text (DTC) which appears in the top right of the calculated field window. Although Tableau will default to the appropriate dimensions for us we are going to define these now for ease of use later.
[% of Y within X] = SUM([Sales])/TOTAL(SUM([Sales]))
DTC > Compute Using: Advanced > Addressing: Y Dimension, Sort: Sales Ascending
[X%] = [Total of Y]/[Total Overall]
Where:
[Total of Y] = TOTAL(SUM([Sales]))
DTC > Compute Using: Y Dimension
&:
[Total Overall] = TOTAL(SUM([Sales]))
DTC > Compute Using: Advanced > Addressing: X Dimension,Y Dimension, Sort: Automatic
Although the last two calculations are identical, the direction of table calculation yields a very different result. This difference means that when we divide one by the other we get the percentage of each X Dimension compared to the Grand Total.
To complete this viz Add the Calculated fields as follows:
Columns: X Dimension
Rows: % of Y within X
Color: Y Dimension
Size X%
Don’t forget to ‘Show Parameter Control’ to play around with your dimensions on the fly.
In Part 3 we will delve a little deeper in to table calculations as we begin to make our real Mekko using our progress so far.