
With Tableau 8.2 now available, the InterWorks team wants to give you an in-depth look at some of our favorite new features. Our What’s New in Tableau 8.2 blog series covers these in detail. This post is the third post in the series. Check out the full list on our Tableau 8.2 blog channel.
There are several great visual changes in the Tableau 8.2 release, such as more aesthetically pleasing fonts and icons. The most effective use of visualization in this release is the total redesign of the data connection experience. With the data connection process being more visual than before, it makes everything more instinctive – leading the user to make fewer mistakes.
How Does the New Process Work?
Now that I have hyped up the new data connection process enough, let’s take a look at it in action. Things do not change until you select the data to which you want to connect. For this example, I will be using the Sample – Superstore Subset (Excel).xlsx file that can be found in the following directory on your computer: My Tableau RepositoryDatasources. After double-clicking the file, you will be presented with the new, beautifully-designed Visual Data Window shown below.
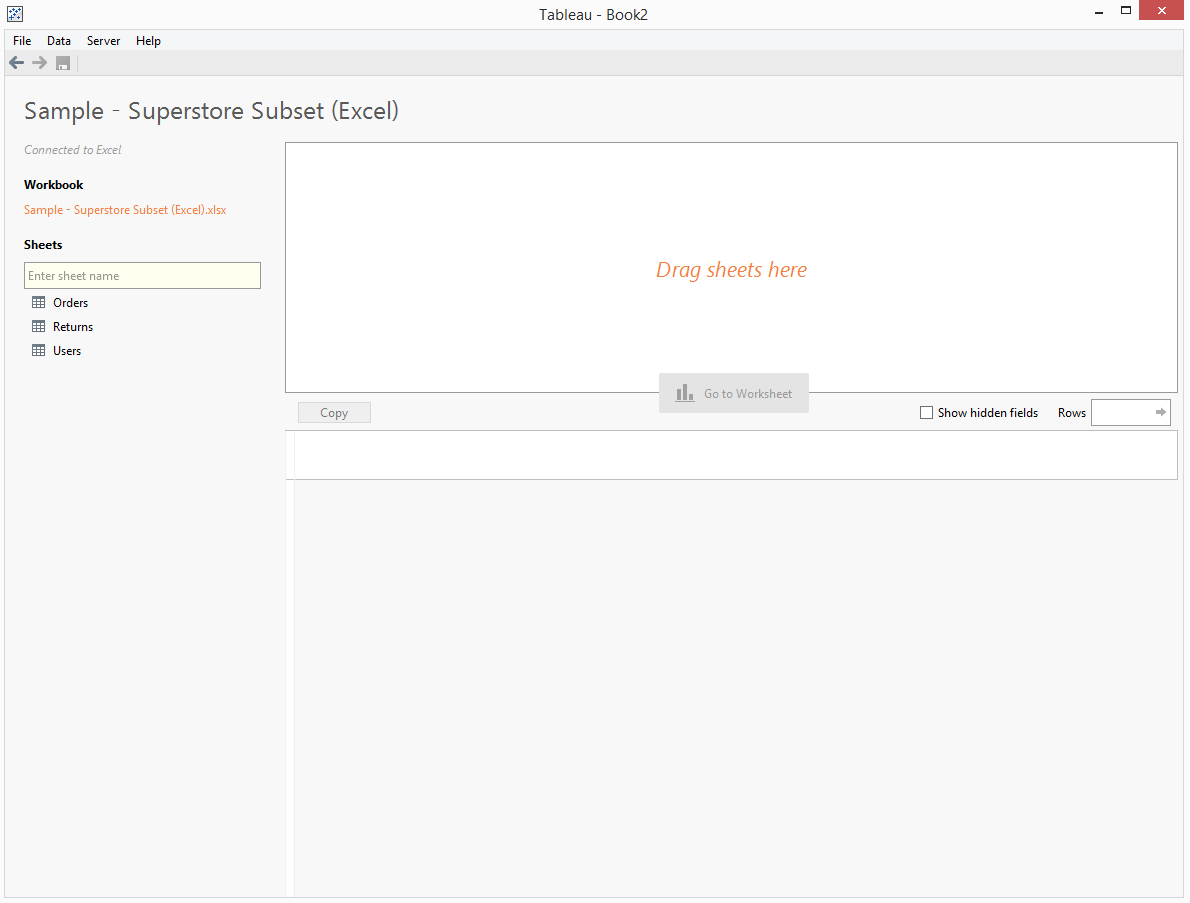
To start the process, drag the primary data source, Orders, to the white space appropriately labeled, Drag sheets here. Then, “boom!” all the data shows up:
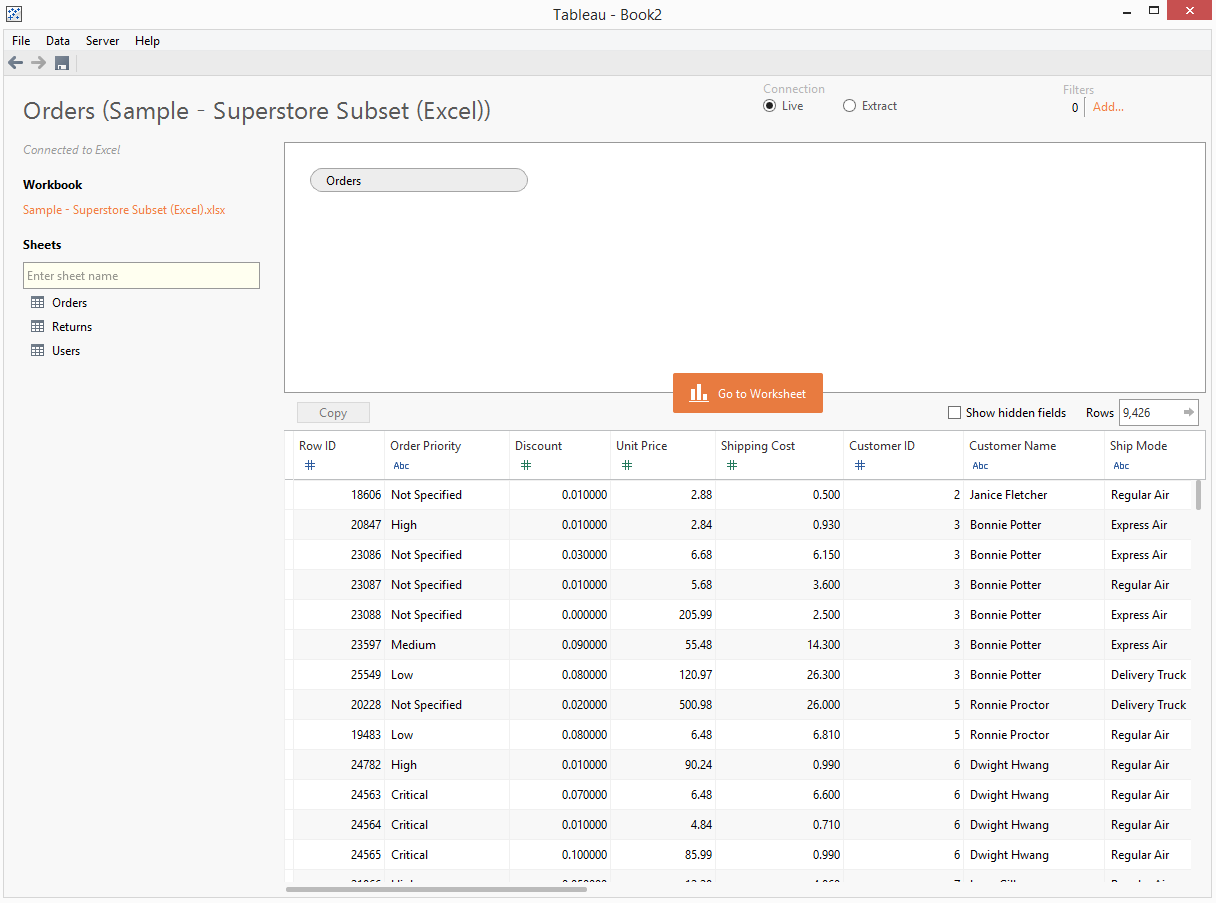
Not only does the data show up, but the field names and data type are presented. The data type icon is extremely helpful because you can change the data type easily. Let’s say you need to change the City field from a string to the Geographic Role of City. All you need to do is click the icon, and you will be presented with a drop-down menu listing the different data type options.
The Join Visualization
Now, let me show you the best part of the redesign: the join visualization. Let’s say that for the analysis you are doing, you also need to view the Returns and Users data. You can achieve this by simply dragging the sheets to the portion of the Visual Data Window where you previously dragged and dropped the Orders sheet. Tableau should then create a join between the data sets. If it doesn’t, just click the two circles. Then, select the join you wish to perform. You can also change or add what fields the join is connecting to from the Join dialog box.
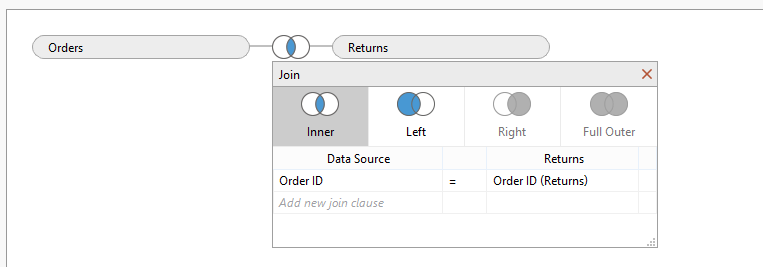
When you drag the Returns sheet, an inner join is created. Let’s say you need a left join because you want to keep all orders in the sheet, but will need to reference which orders were returned.
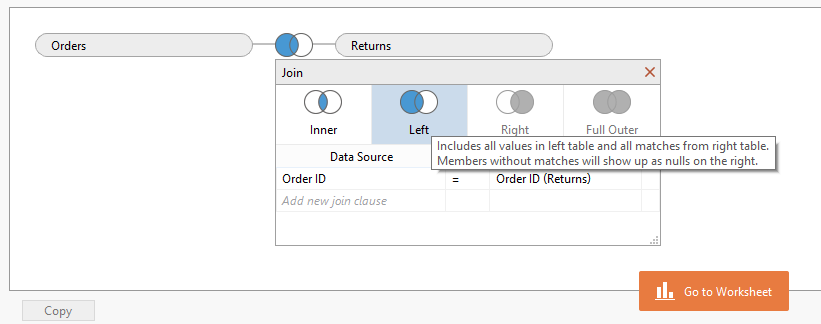
If you are not familiar with how joins work, Tableau has a helpful tooltip to help clarify what each join does. Hover over the square of whatever join you want to know more about and a text box will appear with a brief description. The data is also appended to the end of the data set, so you can see what the join did. You can double check to make sure whether the join you performed was the proper one or not.
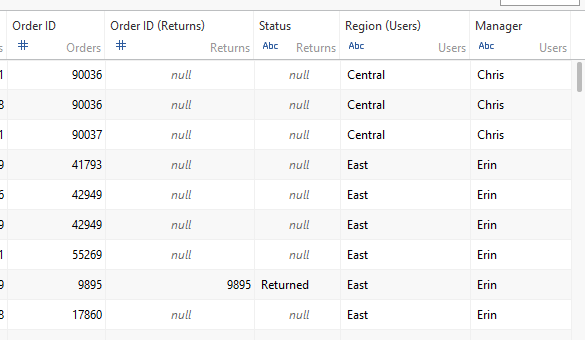
One more way you could check this is by looking at the number of rows in the data set. This can be found on the right, directly above the data list. If you need to join a sheet and keep all rows, and the row total subsequently drops, chances are you need to change the join type.
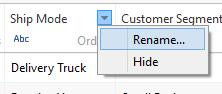
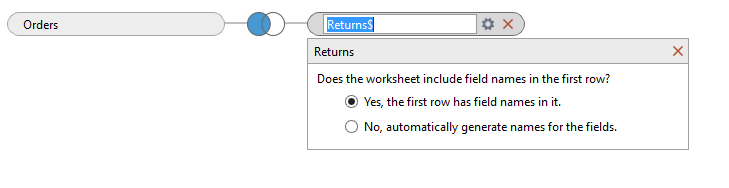
To make changes to the data, click the gear icon to select field name options or to rename the data source. To remove the data, hover over the data source and click the red “X.”
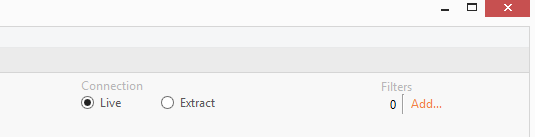
To add a data filter, look no further than the top-right corner. Click Add… under Filters. This dialog box works the same as in Tableau 8.1.
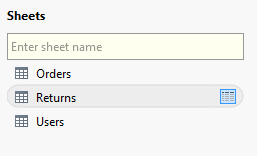
If you are not sure what data is contained in a particular sheet, you can view it by hovering over the sheet name on the left side of the window and clicking the icon that appears.
The last feature is the ease of switching between a Live and Extract connection. Simply click the radio button of what connection type you want.
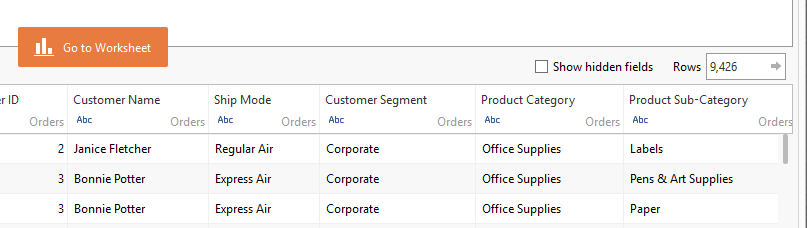
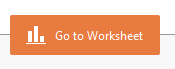
The last thing to do is to click the Go to Worksheet button in the middle of the window. It will take you to your worksheet.
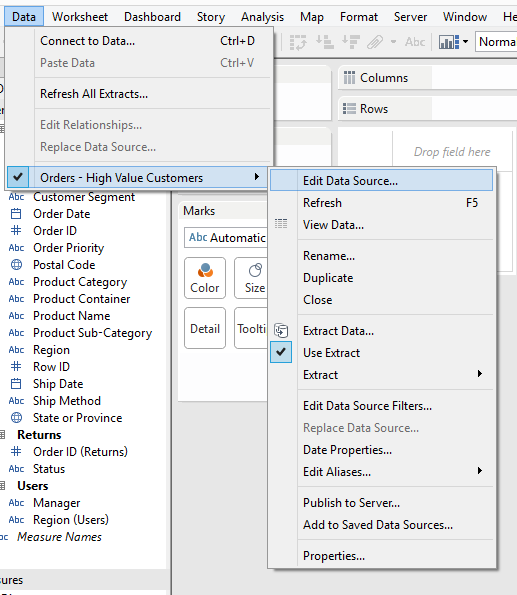
What if you forget, and connect live when you need an extract? Or, what if you need to update a join? Click Data in the top menu bar and select your data source. Then, choose Edit Data Source…
That’s all there is to it! The Visual Data Window makes working with your data sources easier than ever.
Learn More
Want to learn how to utilize the new Tableau 8.2 features in your business? InterWorks is the leading provider of Tableau consulting and training services. Let us know how we can help!