
Setting Up the Problem
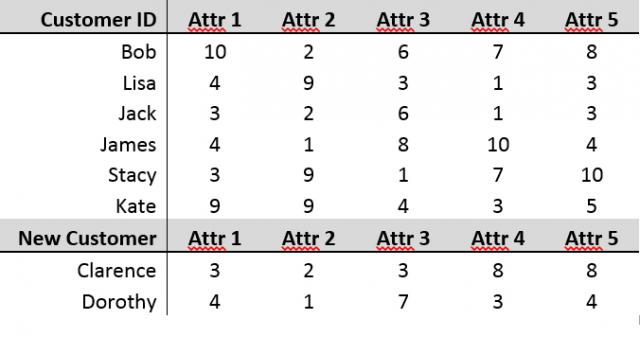
In a study called “Multidimensional Segmentation at Work,” IBM asked marketing departments in various industries to rank their most difficult marketing challenges. Of the top four challenges, two were “identifying when a customer has migrated between segments” and “finding ‘real’ customers that fall into segments.” Suppose we have a set of customer data with five attributes that are measured on a scale from 1 to 10. Hopefully your business is doing well, and you are gaining new customers each day. With these new customers entering your data set, you might want a way to objectively compare these new customers with past customers. This is especially true if you already have grouped previous customers into segments for marketing.
Before we begin to compare, we must define what we mean by comparison. The goal is to obtain an overall similarity percentage between two customers. An example would be that customers Bob and Clarence are 88.3% alike. The power of this kind of comparison is that the more similar a new customer is to an existing customer, the more we can assume their behaviors will be alike. This similarity can also help us to assign new customers to the market segment they most closely resemble.
The calculations for similarity will be done using R. In the next section, I will explain some of the math that drives the calculations. If you would rather just see the results, feel free to skip to “Pairing Your New Customer.”
Cosine Similarity
The similarity percentage above was calculated by using cosine similarity. The concept is easily explained geometrically. For the moment, instead of five customer attributes, let’s say we are only comparing customers on two attributes: Attr1 and Attr 2. The attribute vectors for Bob and Clarence would be and .
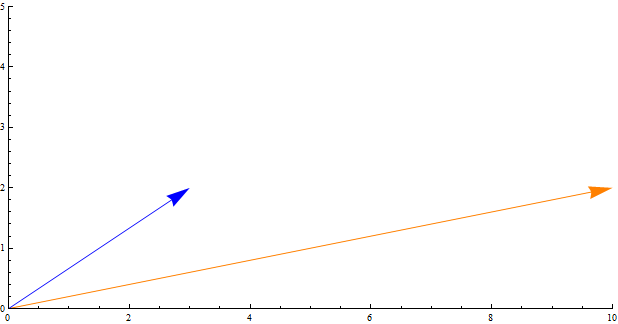
A useful measure of similarity between these two vectors would be the angle between them. If the two vectors have 0o between, they point in the same direction and their similarity would be 100%. For vectors with a 90o angle between, their similarity would be 0%. Most will lie somewhere in-between. For the example above, the angle between the two vectors is about 22o. So, the challenge is to:
- Find the angle between the two vectors
- Convert that into a number between 0 and 1 to function as a similarity percentage
To find the angle between two vectors we use the Euclidean dot product formula.
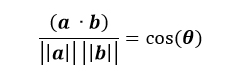
This looks a lot more complicated than it is. The numerator is the dot product of the two vectors and the denominator is the product of the magnitudes. Using the two vectors ( and ) above as an example, the dot product is the first element from each vector multiplied and added to the product of the second element from each vector. If the vector has more than two elements, the pattern continues. The magnitude of the vector (norm) is the length of the arrow; the Pythagorean Theorem.
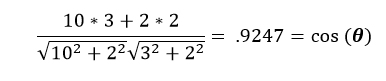
That’s it. No further work needed. The value .9247 means that the similarity percentage between the two customers based on Attr 1 and Attr 2 is 92.47%. This works because the range of the cosine function is between 0 and 1, inclusively. If the angle was 90o, then the similarity percentage would be 0%. This is because cos(90o) = 0. If the angle were 0o, then the similarity percentage would be 100%. This is because cos(0o) = 1.
Pairing your New Customer
Moving back to the original example, we need to calculate a similarity between our new customers and all of our previous customers. This will help us determine which existing customer will help us best model the behavior of the new customers.
The following code in R calculates a similarity percentage between the new customers and each of the existing customers. The output is shown in the table.
# create a function to calculate dot product / norms
sim
sum(customer_data[x,2:6]*customer_data[y,2:6])/(norm(as.matrix(customer_data[x,2:6]),”F”)*norm(as.matrix(customer_data[y,2:6]),”F”))
# create an empty matrix to hold similarity values
sims
# compare each new customer (rows 7:8) to each existing customer (rows 1:6)
for (i in 7:8){
#create empty vector to hold similarity values
temp_sims
for (j in 1:6){
temp_sims = append(temp_sims,sim(j,i))
}
#add values in temp_sims to sims matrix
sims = rbind(sims[(i-7),],temp_sims)
}
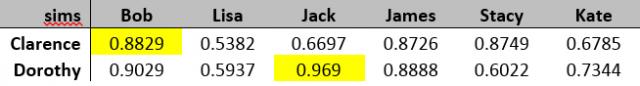
Clarence is most like Bob, and Dorothy is most like Jack. Clarence is 88.3% like Bob, which was stated in the opening section. Cosine similarity is the basis behind certain types of cluster and factor analysis. Algorithms determine groupings that maximize the similarity within the groups and minimize similarity between separate groups. This is, however, only one of the methods used for similarity. If your business already had predefined customer groupings, this method could be used to assign new customers to the appropriate cluster. It could also be used to tell if an existing customer has migrated between clusters as you gain new information.
Applications of similarity extend beyond just customer data. This could be used to compare stock portfolios, school schedules or anything with a set number of positive interval attribute variables. Recently, InterWorks was able to utilize this method inside of Tableau calculated fields to create a unique comparison solution for a customer.