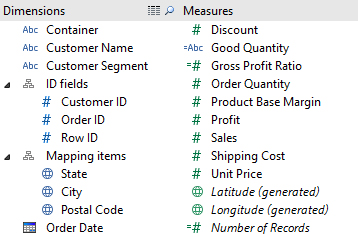
This is the first in a three part series related to the four types of pills in Tableau. The four pill types are discrete dimension, continuous dimension, discrete measure, and continuous measure. Grasping these concepts is important to understanding Tableau and relational databases in general. This article will specifically focus on explaining the less intuitive concepts of non-numeric measures and numeric dimensions. For a more in-depth discussion of the basic properties of dimensions and measures, see the Tableau software online help.
Measures
Measures are the result of a business process event. Aside from an exception listed later (*), a measure is numeric, quantitative information. Quantitative information, as opposed to qualitative, is information that can be measured in a traditional sense (thus measure). A key feature of measures is that they can be aggregated by summing, averaging, etc.
Looking at the Superstore Subset Excel data included in Tableau, we see numeric (indicated by the # icon to the left of the variable name) data in both the Dimension and Measure section of the data window.

Notice that the numeric measure variables such as Order Quantity, Profit, and Unit Price are all quantities that can be measured by observation. For example, Profit = Revenue – Cost and Unit Price is calculated by management based on labor costs, market research, etc. Additionally, these are quantities that we would be interested in aggregating; values like Sum of Sales and Average Profit would be of interest in analysis. These are attributes of measures.
Dimensions
Dimensions are reference variables that give context to measures. A dimension is numeric or character information that is qualitative. Qualitative, as opposed to quantitative, is information that categorizes and cannot be measured in a traditional sense. Often, dimensions are categories such as Region, Department, or State, but they can also be numeric. We use dimensions to compare measures across different types, also called slicing. A key feature of dimensions is that they partition aggregate measures; e.g. Sum of Profit by State or Average Order Quantity by Region.
Notice now that numeric dimension variables such as Customer ID and Order ID are all values that cannot be measured by observation. Given a customer, we cannot calculate the Customer ID in a logical way (unless there is a non-random assignment of customer keys, which is poor practice and not within the scope of this article). Also, unlike measure variables, ID is not a number that would be interesting in aggregation. There is no real business application for the average or sum of Order ID. These are attributes of dimensions.
Non-Numeric Measures
(*) The calculated field Good Quantity is a string measure. The field was calculated using this formula:
IF SUM([Order Quantity]) > 2000 THEN ‘Good’ ELSE ‘Bad’ END
This creates a string value that corresponds to a specific aggregate value, sum in this case. Good Quantity is a label for an aggregate measure that can be partitioned by dimensions such as State or Region to determine if their order Quantities are Good or Bad.
However, we could have used this formula instead:
IF [Order Quantity] > 50 THEN ‘Good’ ELSE ‘Bad’ END
Tableau would place this value in the Dimension section of the data window because it is a line calculation. Here, Good or Bad is a quality of a specific observation in the data set. While it is still measured, in a sense, it pertains only to one specific observation and cannot be partitioned by dimensions.


