
Neutrality has always been a key concern in data analysis. As analysts, it is critical that we not introduce our own bias into the interpretation of data. Anyone who has had a statistics class is familiar with the importance of random samples and neutral questions. However, today’s analysts are accustomed to handling data that is much closer to a census, unburdened from many traditional issues regarding sampled data. Unfortunately, our decisions about how to manage and display these large data sets can still have unintended consequences that can bias data and lead to erroneous conclusions.
The Missing Data Problem
Data is gross. Like a music festival, the larger the set the nastier it gets. Even if it is cleaned and formatted, there is still the issue of missing data. How do we handle it other than wish that it wasn’t there? Well by far the easiest way is to ignore entries with missing data or treat them as a special case. Another method is imputation, which replaces missing variables according to a chosen process. Both of these are viable options, but the analyst has to ensure that the missing data is missing completely at random. Replacing or ignoring entries with data that is not missing completely at random can lead to biased outcomes.
For an easy example, suppose you were looking at a data set containing votes cast by the members of the House of Representatives. As an analogy, compare abstained votes to missing data. Abstained votes are political statements just as much as the votes themselves, so we cannot say that these votes are missing completely at random; the probability that the data is missing is based on party affiliation. This happens often in data sets, especially those based on survey. People below a certain level of income are less likely to report their income than those above that level. Mental health issues affect how people report their mental health issues. Simply ignoring these observations because of missing data can skew your results.
So how can we tell if a member of the house missed a vote because he was stuck in traffic or because he didn’t want to make a political statement on a divisive issue?
Creating the Visualization in Tableau
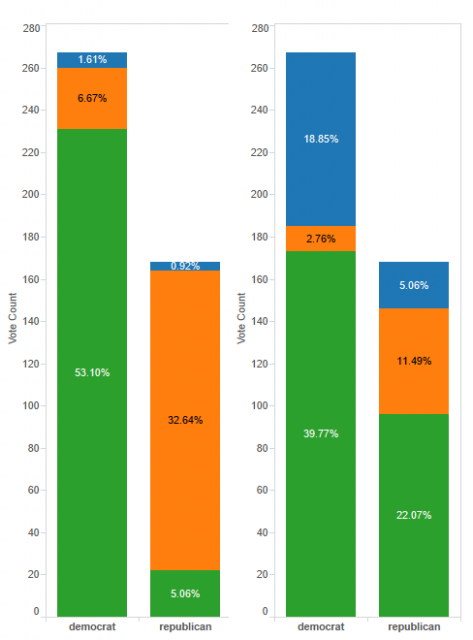
Using Tableau, we can clearly see that missing votes on two issues in the data set might be skewed along party lines. I have created the simple stacked bar chart shown below by using the Democrat/Republican variable as both a measure and a dimension. The column shelf contains the category and the row shelf contains the count of each category. Color the chart by the vote in question and use a table calculation to display the percentages as a label.
A Look at Missing Data Patterns
Democrats, more so than Republicans, tended to skip the second vote. If, for some reason, you were analyzing these votes and chose to simply exclude observations with missing data, then you would be inadvertently introducing bias by deleting mostly Democrat voters. A whopping 18.85% of Democrats skipped this vote compared to 5.06% of Republicans. However, if the vote in question was the first vote, where Republicans and Democrats abstained at about the same rate (1.61% compared to 0.92%), then it would be a safe bet to perform a list-wise deletion of observations with missing data. The voting record is a bit of an oversimplified example, but you can see how it extends to other forms of missing data.
How to deal with non-random missing data is beyond the scope of this piece, but it is important for all analysts to avoid incidental bias. For those interested, I would encourage you to read further about multiple imputation methods.