
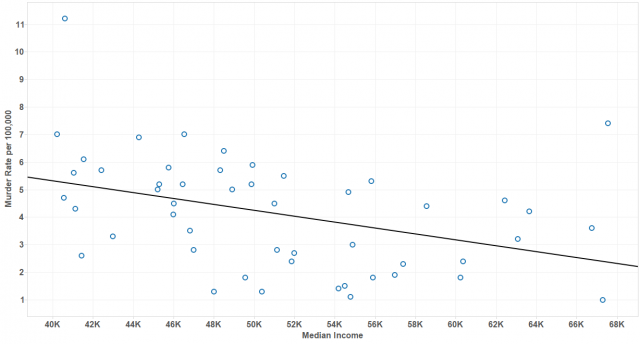
If I were to ask you to name the three most significant factors that predict the murder rate within a geographic area, then I would expect you would name some measure of median income. To test this hypothesis, we could do a simple linear regression using Tableau as I spoke about in Part 1, but that is kind of boring. It can also be inaccurate. The first assumption for linear regression is the independence of observations. If you were to plot Median Income against Murder Rate for all of the U.S. states and calculate a regression line, then the assumption is that each state is an independent observation that is unaffected by neighboring states.
The Independence Assumption
This assumption works well for geographic areas as large as states and in the graph above we see the expected result that Murder Rate decreases as Median Income increases. The model shown is significant with a p-value of .0048. What if we wanted to create the same model on a more local level by zip code? Can we still make the assumption that each area is independent of its neighbor? Realistically, zip codes are arbitrary separations and not concrete geographic boundaries. For that reason, we cannot assume that a relatively wealthy neighborhood isn’t affected by the murder rate from its neighbor and vice-versa.
Murder Rate and Income by Zip Code
Everyone is a fan of The Wire, so I thought we could look at crime data from Baltimore, MD and compare the income and murder rates of their twenty zip codes. As I have stated before, I am a fairly new user of the Tableau software, and I found it amazing that all of the GPS coordinates for U.S. zip codes were included by default. To create the visualization below, simply drag the Zip Code dimension to the Marks shelf and separate color by dragging the Median Income measure to the color icon.
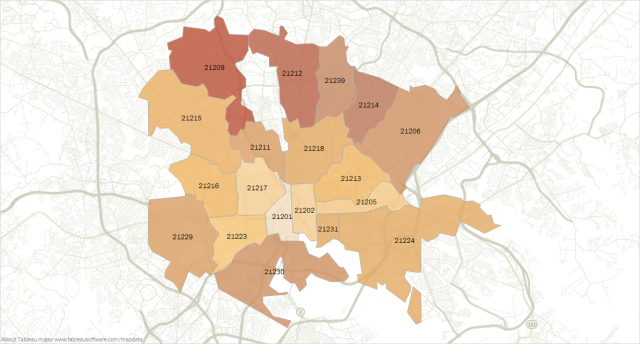
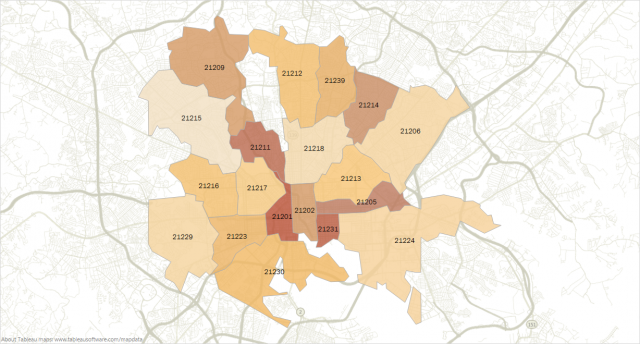
The visualization above is a heat map of Baltimore zip codes. A darker color of orange indicates a higher median income. Using the same methods as before, we can create another heat map based on Murder Rate per 100,000 as shown below:
Spatial Autocorrelation
These two maps are easy to create, and their juxtaposition can tell us a lot about the relationship between income and murder without looking at another xy-plot. As we expected, the lower-income, inner-city neighborhoods generally have a higher murder rate than the higher-income suburbs. However, if we look a little longer, we can see that some high-income zip codes have a much higher than expected rate of murder, such as 21209 and 21214. This could be explained by spatial autocorrelation, a measure of the degree of dependency among observations in a geographic space. In plain English, this means that sometimes we can treat variables like a crime as a disease. Observations are “contagious” and a high-income observation in close proximity with a low income observation can be “infected” by their crime rate. For example, the higher-income 21209 and 21211 may be experiencing an increase in their crime rate due to the I-83 corridor connection to the 21201 zip code. Thanks to Tableau, it is easy to get a map overlay that includes streets and highways.
Data
The data used were found at the following sites: