
Have you heard that if you send your husband to purchase diapers at the grocery store it is statistically more likely he will also purchase beer? Unexpected relationships like this in your data can be found with what is known as market basket analysis, or in statisticians’ terms, association analysis.
I’d like to walk through an example of how we can use this analysis in your data and even make it interactive for end users. We’ll start with a transactional table of customer purchases and looking at what items go together. The example we’ll walk through uses R and Shiny, and it was created by my fellow InterWorks teammate, Alex Lentz.
What Is Market Basket Analysis?
Market basket analysis is essentially the process of determining whether or not a relationship exists in your data between different discrete values. A reason for it being called “market basket” analysis is that it’s generally applied to transactional data. A good example would be the products you put in your “basket” to purchase from the farmers’ “market.” Have you ever noticed that if you’re craving a PB&J and you find the bread, you’ll probably find the jelly nearby and then, nearby, you’ll see the peanut butter? The reason for this is market basket analysis.
Stores look at the data they’ve gathered from sales and see which products are more often purchased together and then design the store so those products are placed together. There is a method to their madness! Let’s look at some of the key terms we’ll use:
Rules:
A rule is simply a question about the association of products purchased together. There is a left-hand side and a right-hand side to each rule, and the rules are read from left to right. They’re displayed as:
Apple Tart => Apple Croissant
Which would translate to “If you purchase an Apple Tart, what is the likelihood that you also purchase an Apple Croissant?”
Lift:
The lift is the how many times greater the association is between the sides than just mere chance. This really means that that if a customer purchases an Apple Tart then they are “lift” times more likely to purchase an Apple Croissant. So, if the lift is 2 and I also buy an Apple Tart, then I am twice as likely to also purchase an Apple Croissant.
Support:
The support is just the percentage of transactions that include the full rule. So, since we said that the rule was Apple Tart => Apple Croissant, then the support is just the percentage of transactions that included an Apple Tart and an Apple Croissant.
Confidence:
The confidence is a little trickier to define. The easiest way to consider confidence is to imagine all of the Apple Tarts purchased and then find the percentage of those transactions that also included an Apple Croissant. So, mathematically, the confidence is saying, “Given an Apple Tart was purchased, what is the probability an Apple Croissant was also purchased (this is Bayes Theorem, which can be explained another day)?
Think of lift as the strength of the association or relationship whereas the support and confidence explains how much data actually supports this relationship.
The Fun Stuff
Now that everyone understands what market basket analysis is and the important terms that go with it, we can start discussing what we did and what we found.
R and Shiny:
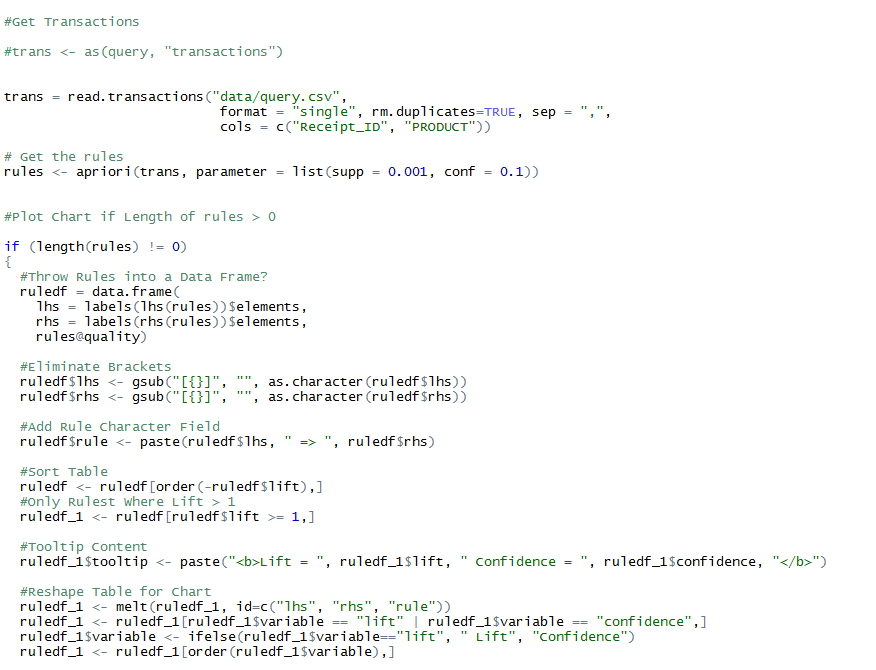
Our association analysis was performed using R and then visualized interactively in a Shiny application. Below, you’ll find a snapshot of the code that was used for getting the results of the association analysis. The package arules was used along with the corresponding commands for generating the rules, lift, support and confidence.
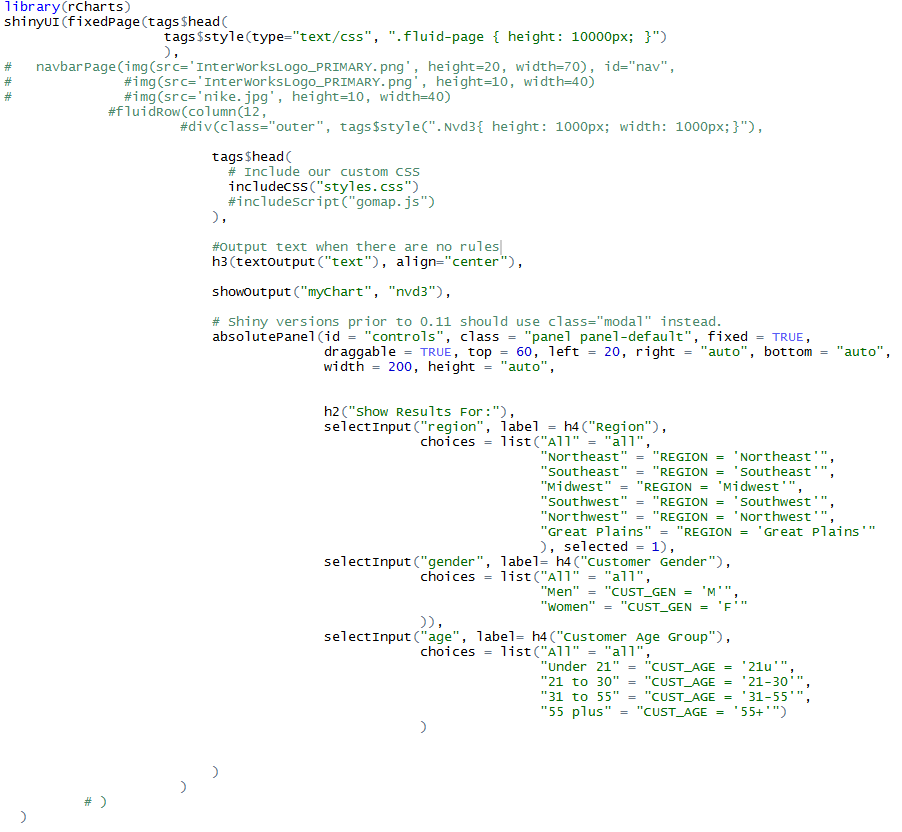
Next, we needed to figure out a way to visualize our findings. The code below built a web interface using the R package Shiny. Shiny is a package used to create visualizations that are then used as interactive web applications.
Time to Explore
The interactive demo below is the interface built using Shiny. Explore the results by selecting options from the filters on the left. Go ahead, put your own information in there, we won’t tell if you fib on your age group.
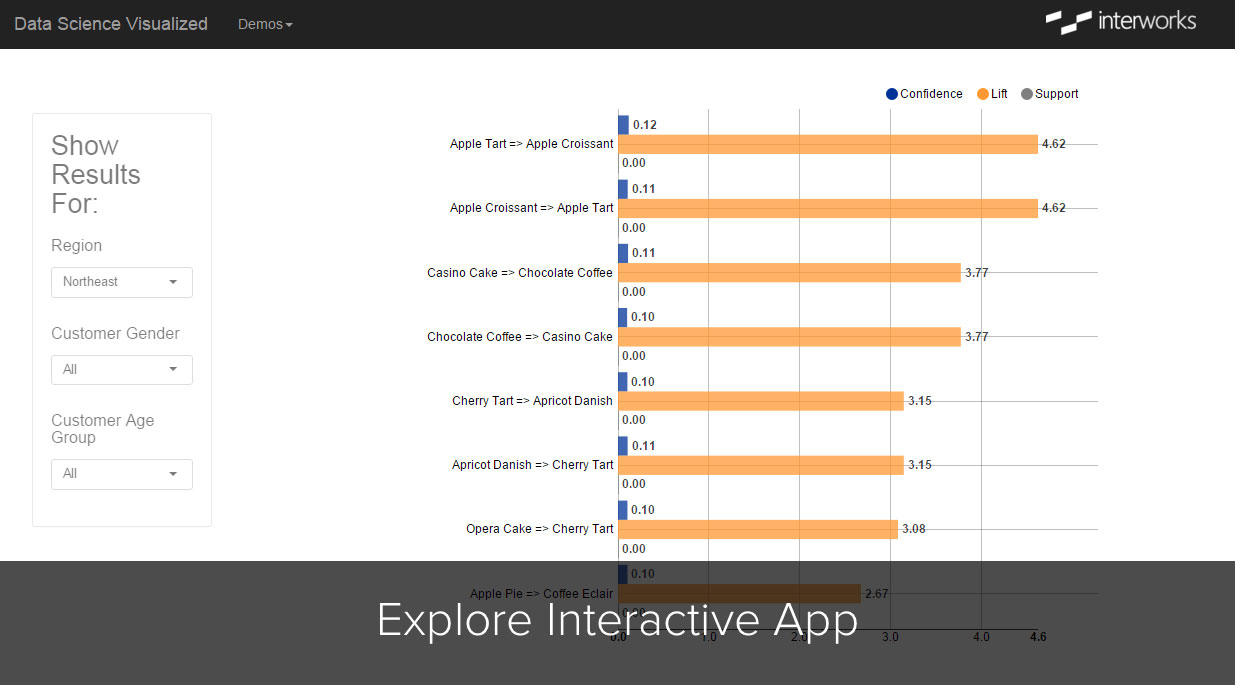
You can see the various colored bars for each Rule. For example, if we filter the data to just the Northeast region and leave gender and age group set to all, we can see that the first Rule is “If a customer purchases an Apple Tart, how likely are they to purchase an Apple Croissant. We can answer this from the data provided. With a lift of 4.62, we can say, “If a customer purchases an Apple Tart, they are 4.62 times more likely to also purchase an Apple Croissant.” Because the second Rule is the opposite, we know that it doesn’t matter which order a customer purchases; they would still be 4.62 times more likely to purchase the other. With a Confidence of 0.12, we can also say, “If an Apple Tart was purchased, then 12% of the time an Apple Croissant was also purchased.
This concludes our exciting journey through market basket analysis. I hope you’ve learned something. Now you know the next time your wife asks you to go to the store for more diapers and you come home with beer as well, it’s not really your fault – it’s just simple statistics.