Planning a holiday can be quite stressful in its own right. However, when I was planning a recent trip to Asia that involved making multiple stops across many countries, it was even more so! My fiancé’s cousin was getting married in Okinawa, so we decided to make a bit of a trip out of it. We thought it’d be a great idea to go to Singapore where I also got a chance to visit Jia, who is based in InterWorks Singapore:

Above: Here we are enjoying some fish soup at one of the hawker markets in Singapore.
After visiting Singapore, we decided to fly to Okinawa and then finally headed to Hong Kong to visit family. Over a three-week period, we ended up booking four flights through four different airlines and staying in four different hotels or Airbnbs.
Getting Organized with Tableau Calendar View
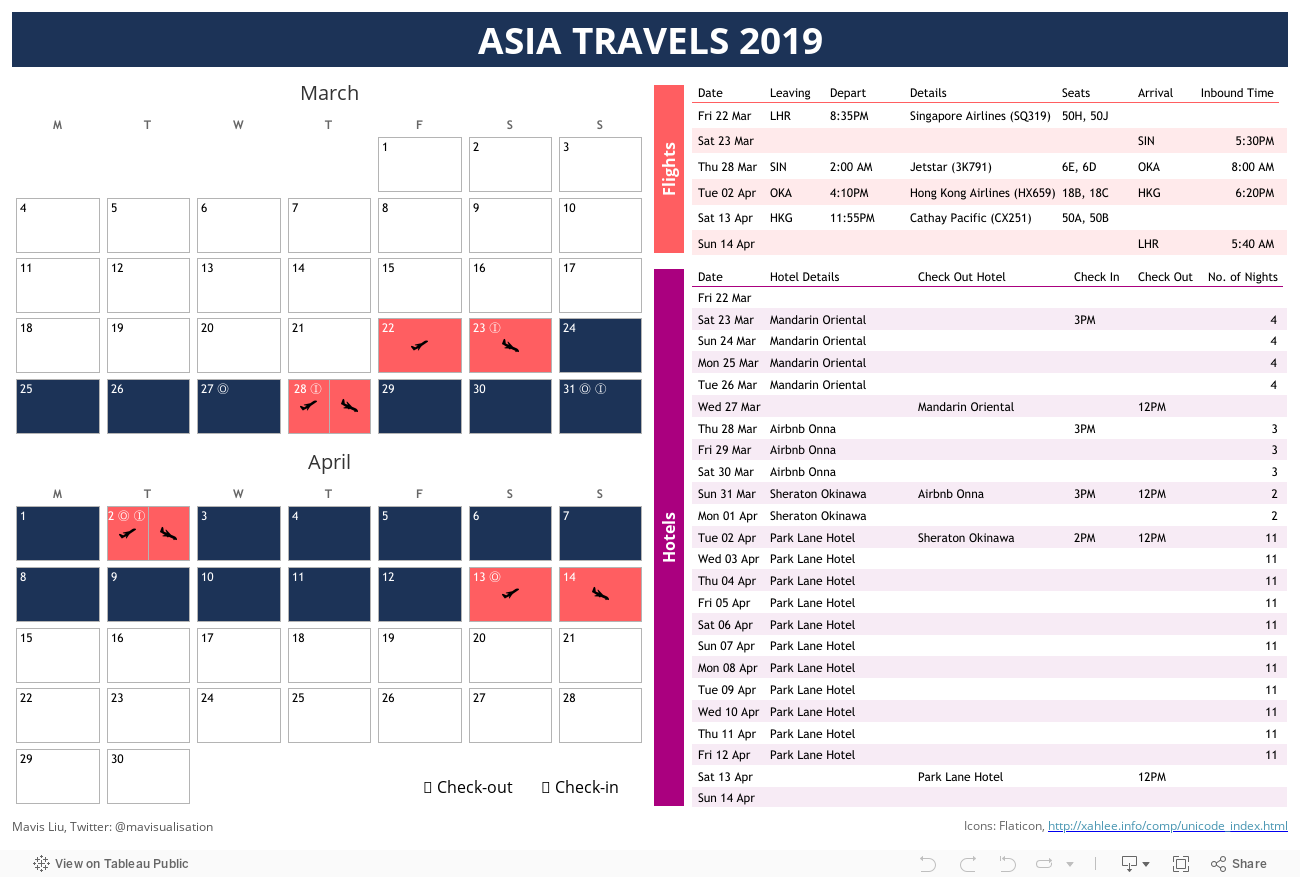
Although I had planned it all out in a Google sheet, I wanted to create something a bit more useful and visual for me to know which days I’d be flying and which hotels I’d be staying at over the course of my trip. I decided that creating a calendar view in Tableau would be beneficial in my planning, and I ended up making the dashboard at the bottom of this post.
Before creating something like this, getting the data in the right shape and form was the most important thing. To build the calendar view, I needed all the dates in March and April (regardless of whether I was on holiday that day). This was to ensure they appeared in the visualisation, e.g. March 1 can appear as the white box in my calendar worksheet:
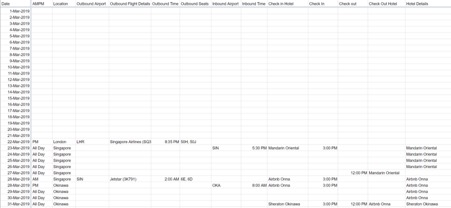
Within the data, I included important details such as the date, location, flight, hotel information, etc. The Location column is based on where I’d be on a given day. On some days, I’d be in one place for the morning and another in the evening. In these cases, I created two rows of data. This is important for later on. The Hotel Details column is based on what hotel I’d be staying in for that night. For the evening of March 27, no hotel is listed as my flight was at 2:00 AM on March 28!
Building the Calendar View in Tableau
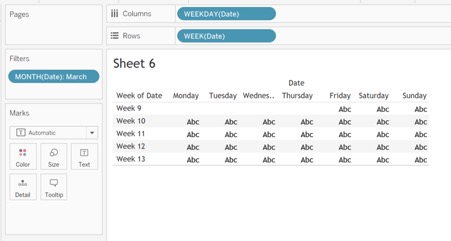
Once the data is in place, I can now start to build out my calendar worksheet. I brought in my discrete date fields WEEKDAY(Date) and WEEK(Date). I wanted to focus on individual months, so I filtered down to March:
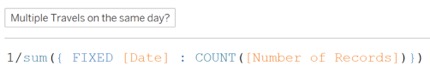
The next step was trying to work out whether I was in multiple locations in the same day. The below LOD [Multiple Travels on the same day?] is to break down each of the blocks so that I can display different items on the same day in the calendar. I brought this field into my Columns:
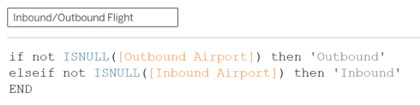
Then I created another calculation [Inbound/Outbound Flight]. I brought the below field into Detail and changed the marks into a bar chart. Changing it into a bar chart is crucial as the calculation will break down the blocks/bars to show multiple travels:
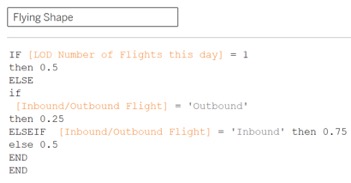
Next, I looked to position my plane icons based on whether I’m taking off or landing. I created the below field [Flying Shape] and brought it into Columns then created a dual axis and synchronised the axes. I then removed measure names from Colour and changed the marks card for [Flying Shape] into a shape mark:
Then I brought in [Inbound/Outbound Flight] to shape and changed the shapes of the icons to the planes (I found my icons from Flaticon). For the Null, I assigned it as a blank shape:
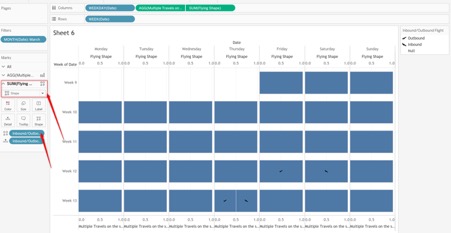
Next, I wanted to add a bit of colour to my calendar, so I decided to base it on whether I’m on holiday and whether or not I’m flying:
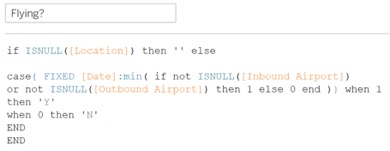
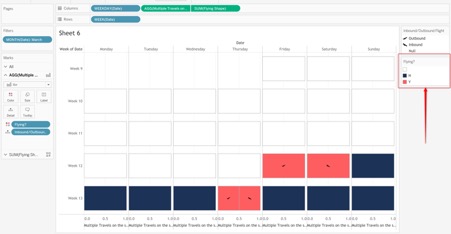
Bringing [Flying?] into colour gave me the blank boxes in white for non-travel days, the pink for days I am flying and blue for all other travelling days. I finished by doing a bit of formatting, such as adding in a border, changing the axis to range from -0.05 to 1.05 and hiding some of the headers.
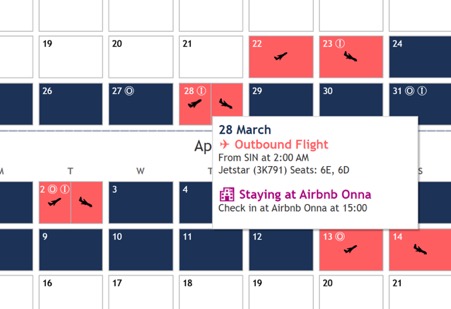
Finally, I had a bit of fun playing around with the tooltip!
Build Your Own Travel Calendar
Creating this calendar view really helped me not get lost in my travels! It was clear to see which days I was flying and which hotels I was checking in and out of. Next time you’ve got a vacation to plan for, try it yourself and build a travel calendar, too!