The initial request that led me to create this dashboard came from a client working in the sales department of a manufacturing company. The challenge was unique: if a customer requested a product that was out of stock, they could quickly find alternative products with similar components or identify what parts needed to be added/removed from another product to fulfill the order. While that situation may have been fairly rare, I believe the underlying logic needed to do this can be used in a variety of applications.
Logic Use Case
The goal behind this request was really about being able to select an object in Tableau and identify shared underlying components with another object in the date source.
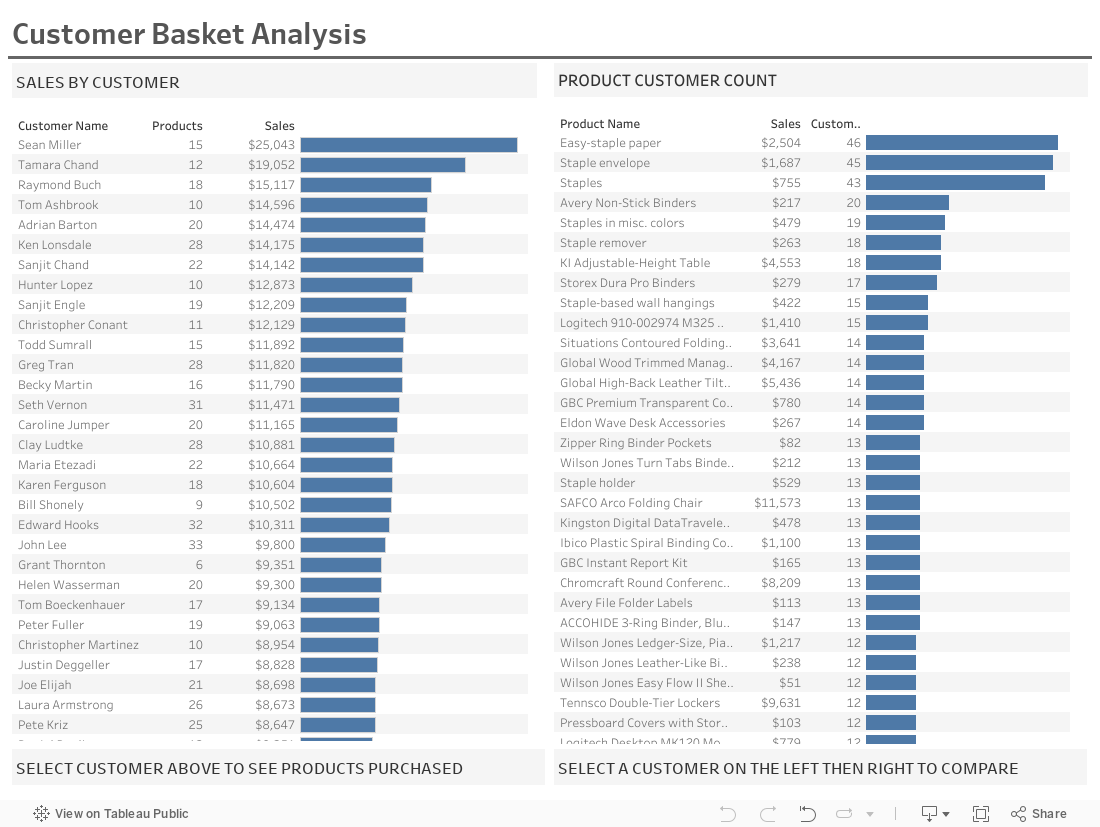
For this example, I have used the same logic to be able to do a rough basket analysis on customers in the Superstore sample dataset built into Tableau. The dashboard is set up to start with a simple view showing sales dollars by customer and count of unique customers by product. Users are also able to drill down and find shared products between customers to potentially identify other products that customer might be interested in. This dataset is very limited in that there is very little overlap in the products customers buy.
When I select Customer A, I want to check the products that they purchased and flag all other products shared with other customers:
Dashboard Navigation
Optional: Selecting a product filters the chart on the left to show a ranked list of customer sales dollars for that product while still showing the total number of unique products purchased by that customer.
Selecting a customer triggers two charts to appear in place of the product list. A list of products purchased by the customer selected appears below. showing the number of customers who bought that product and the sales dollars for each product purchased by the customer.
A list of other customers that bought products also purchased by the customer in question appears ranked by sales dollars on the right. Hovering over a customer on the right side shows a list of the Top 20 products for that customer by sales dollars with shared products in red.
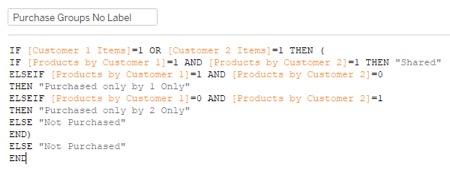
Selecting a customer on the right side triggers a list of products purchased by both of the customers. That list is broken out by those products that are purchased by only the first customer, only the second customer or both.
Parameters and Set Actions
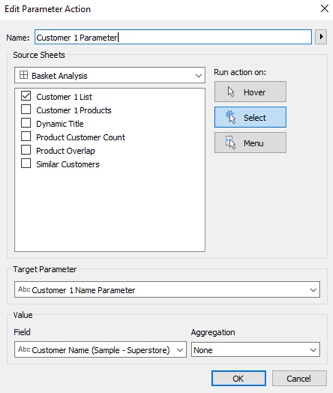
This can be done with either a parameter action or a set action. Using a parameter action allows for the name of the customer selected to feed into the display. A set action would allow for a situation where a multi-select is needed.
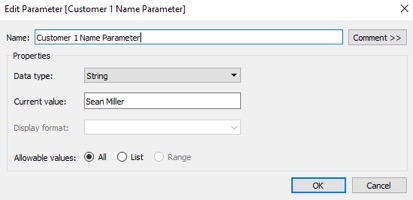
Create parameters for the first and second customers selected with String as the Data type and all values allowed:
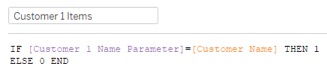
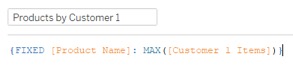
Create a calculation to flag all products purchased by the customer selected in the parameter. This example is using a customer name, which should be replaced by a customer ID field in a real environment:
Create an LOD calculation to flag all instances of a product purchased by the customer selected for all customers:
To use these calculations, I need two sheets showing sales by customer to pass the customer selection between. The second sheet is filtered so that only sales of shared products are displayed. The Products by Customer 1 field is set as a filter to only keep records where it equals 1. I then have to decide if I want to see records from the customer selected in the second sheet. I decided to remove these by adding a filter using an ad hoc calculation: [Customer Name]<>[Customer 1 Name Parameter]. In a dashboard, I add both sheets and set up the parameter action filter to update the parameter when I select a customer:
Action Filter Using Dummy Field
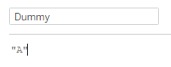
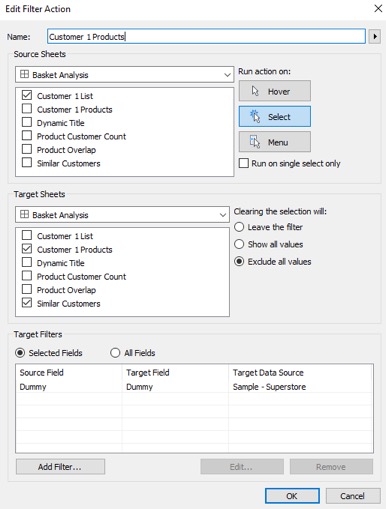
The second sheet now will always display customers that purchased the same products for the last customer selected. Since I want this view to only be displayed on selection, I created a dummy field that could be passed between the sheets to activate the display. This could be any value; it just needs to be consistent. I place this field on Detail on the first sheet to make it available. Next, I set up an exclude action filter using the field to the sheets I was hidden until a customer is selected:
I’ll repeat these calculations for the second parameter in order to label products as either purchased by both customers selected or just one: