The 2019 Gartner BI Magic Quadrant Visualized in Tableau

Data

The 2019 Gartner BI Magic Quadrant Visualized in Tableau

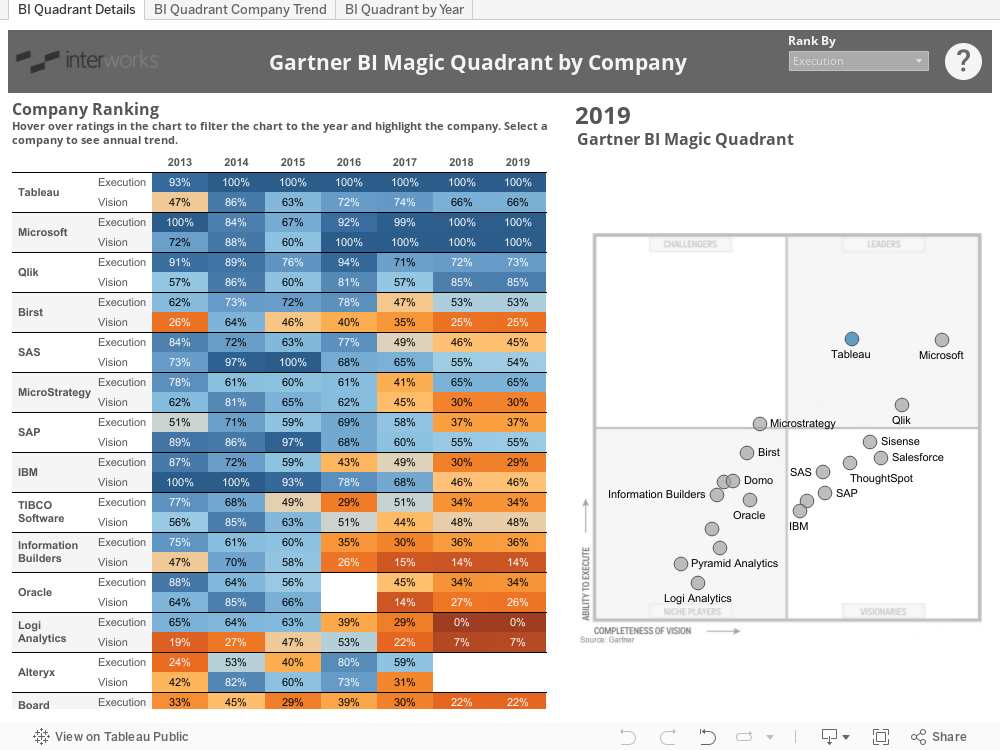
Not too long ago, Gartner released their updated Magic BI Quadrant for 2019. This quadrant ranks the industries top BI platforms on both execution and completeness of vision. Since it’s become a bit of a tradition for me to visualize the results in Tableau, I thought I’d update my viz for 2019. There are three tabs below that slice the data in different ways, but the main idea in each is to show how platforms change over time, at least using Gartner’s criteria. Dive in and see which platforms have emerged, which have improved and which have taken a step back. Just remember that Gartner’s perspective is only one perspective.

More About the Author

Kent Sloan

Services Lead
Say Less: How To Ensure Your Tooltips Add Value We’ve all done it. We’ve completely ignored the warning label. You know, the one we probably see everyday: CAUTION: Contents Hot We ...
Visualizing the 2022 Gartner BI Magic Quadrant in Tableau Gartner has released its annual Magic Quadrant report for 2022, and, per tradition, I’ve visualized the report in Tableau. Each ...

See more from this author →

InterWorks uses cookies to allow us to better understand how the site is used. By continuing to use this site, you consent to this policy. Review Policy OK

×

Interworks GmbH
Ratinger Straße 9
40213 Düsseldorf
Germany
Geschäftsführer: Mel Stephenson

Kontaktaufnahme: markus@interworks.eu
Telefon: +49 (0)211 5408 5301

Amtsgericht Düsseldorf HRB 79752
UstldNr: DE 313 353 072

×

Love our blog? You should see our emails. Sign up for our newsletter!