Visualizing Oklahoma Earthquake Activity

Data

Visualizing Oklahoma Earthquake Activity

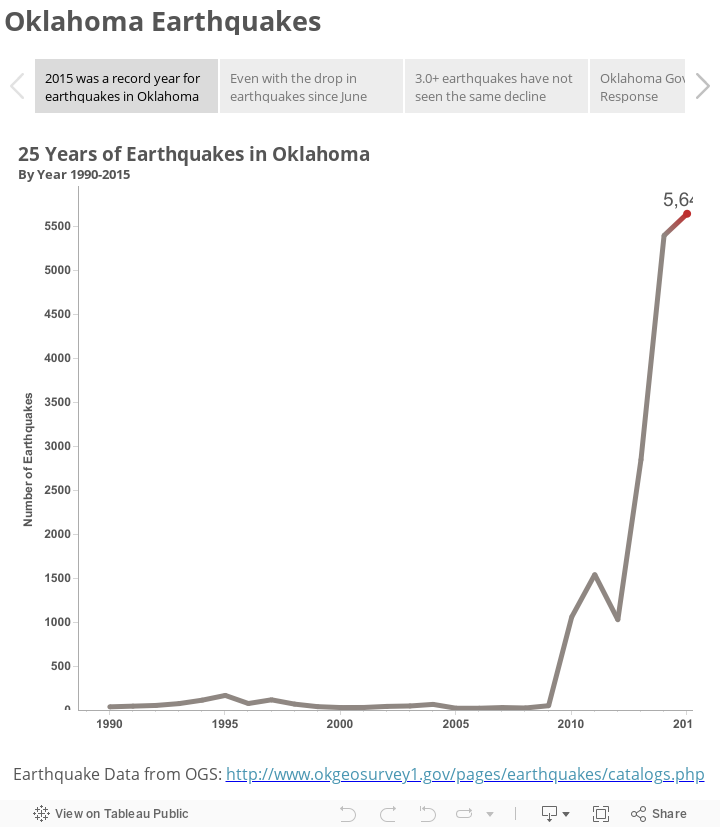
I grew up in Oklahoma, but I can’t claim to have felt an earthquake in the state until I moved back in 2014. A series of earthquakes in the last few weeks prompted me to find a data set and take a look in Tableau. I wanted to see how the number of earthquakes has changed over time and where they are occurring. Below is the viz I came up with, highlighting the change in earthquake frequency in 2015. Click through the tabs in the storyboard and mouse over the visuals to see why 2015 was a record year for earthquakes – even with a 600% drop in the number of earthquakes per month from June to December:

More About the Author

Kent Sloan

Services Lead
Say Less: How To Ensure Your Tooltips Add Value We’ve all done it. We’ve completely ignored the warning label. You know, the one we probably see everyday: CAUTION: Contents Hot We ...
Visualizing the 2022 Gartner BI Magic Quadrant in Tableau Gartner has released its annual Magic Quadrant report for 2022, and, per tradition, I’ve visualized the report in Tableau. Each ...

See more from this author →

InterWorks uses cookies to allow us to better understand how the site is used. By continuing to use this site, you consent to this policy. Review Policy OK

×

Interworks GmbH
Ratinger Straße 9
40213 Düsseldorf
Germany
Geschäftsführer: Mel Stephenson

Kontaktaufnahme: markus@interworks.eu
Telefon: +49 (0)211 5408 5301

Amtsgericht Düsseldorf HRB 79752
UstldNr: DE 313 353 072

×

Love our blog? You should see our emails. Sign up for our newsletter!