My colleagues and I often joke about how the most interesting visualizations on Tableau Public don’t often have much practical application for the boring world of business dashboards in which we operate. At first glance, my Spell-O-L dashboard is no exception.
Telling a Visual Story
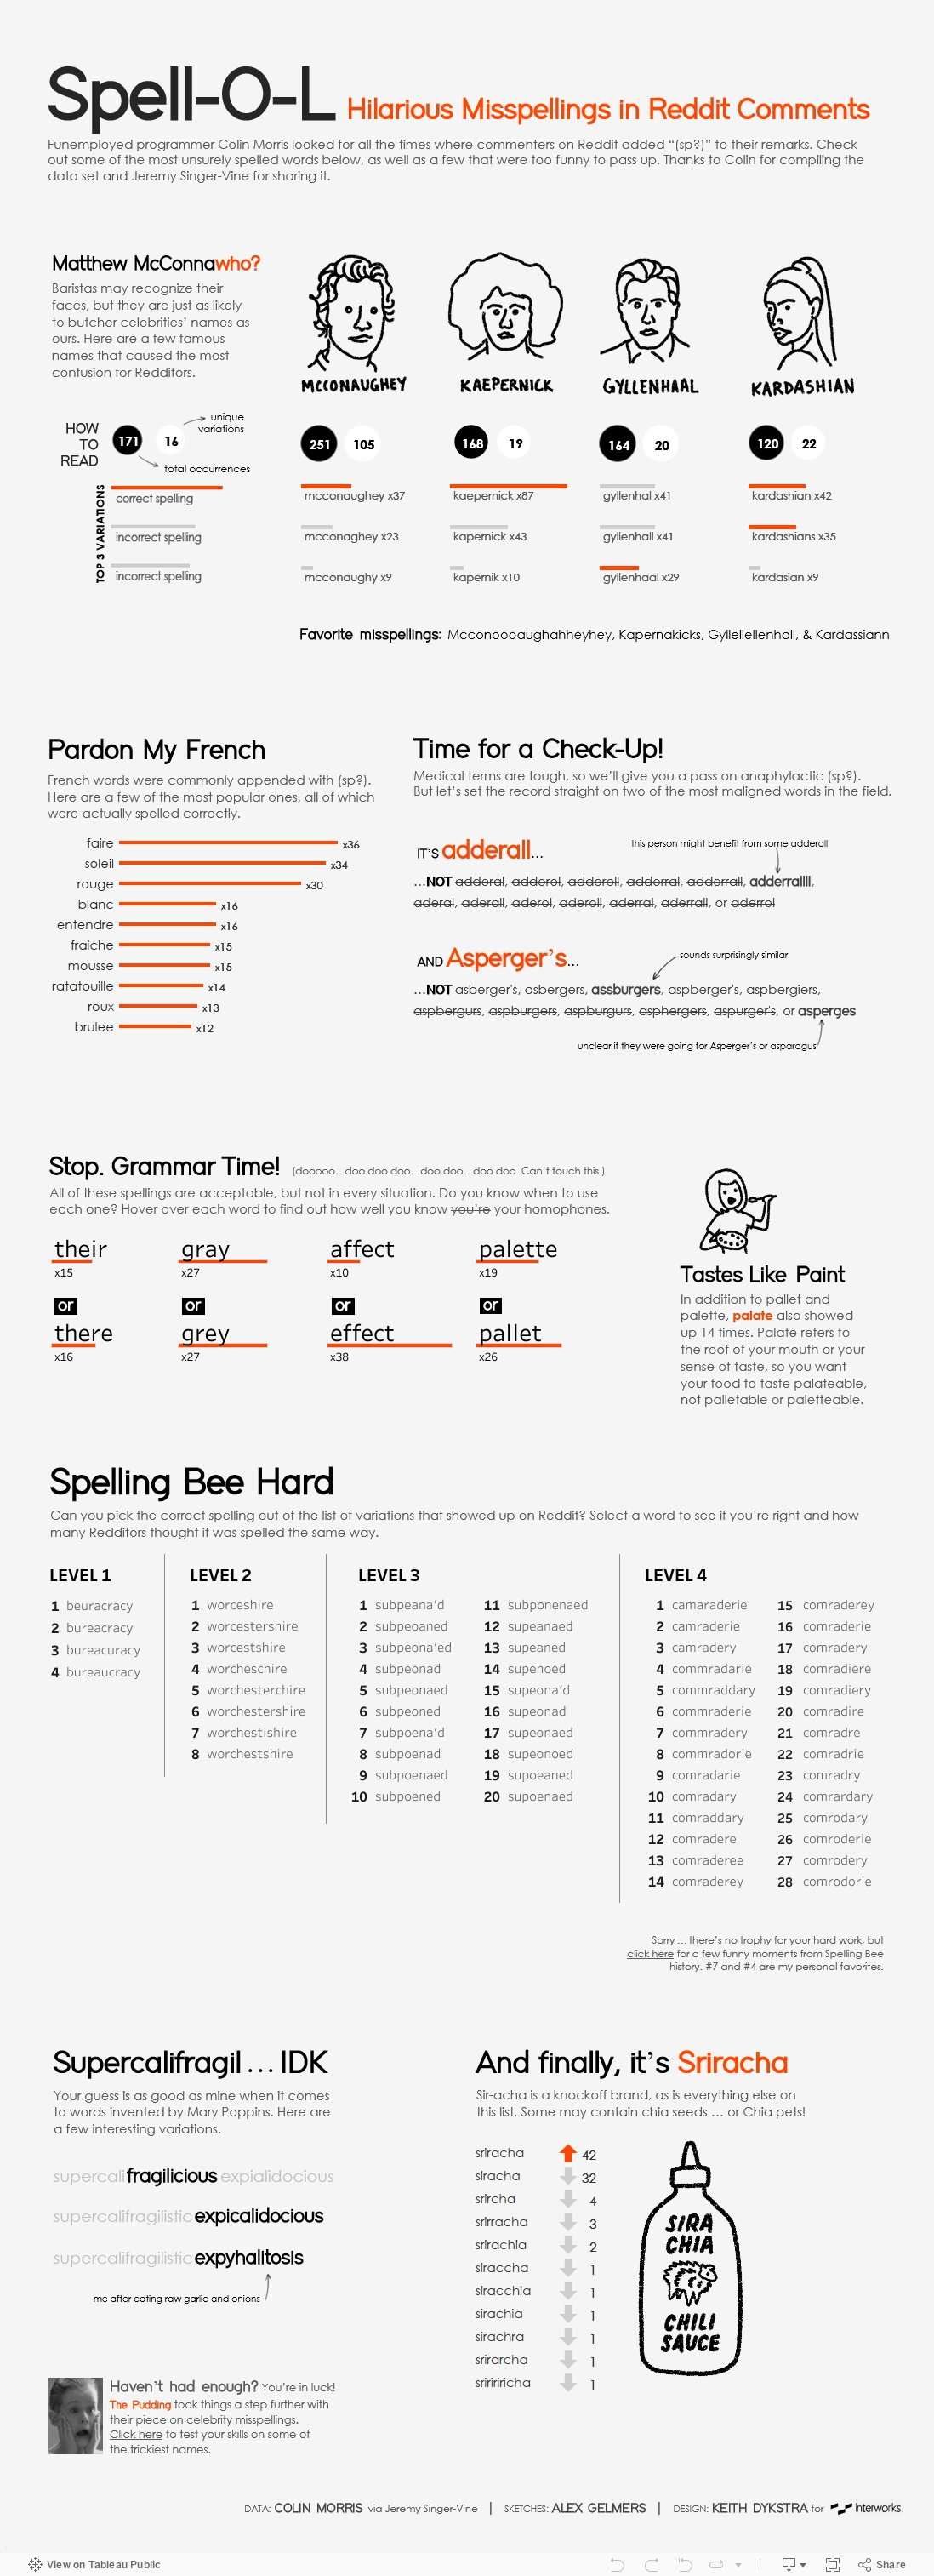
This visual story about spelling errors in Reddit comments gained traction a lot quicker than anything else I’ve shared on Tableau Public, but that’s largely because it has two things going for it that most normal dashboards never will:
- The content – People are much more likely to click on a visualization about funny misspellings than, say, the other dashboard I’m working on right now, which measures the energy efficiency of steam generators.
- The sketches – Charts (even straightforward ones) can take a few seconds to interpret, but sketches of celebrities are almost instantly recognizable. They are also visually interesting, so they grab users’ attention and draw them in.
Sharpen Your Design? Aye
Despite the fact that this dashboard has some unique things going on, I think there are still some lessons to be learned from it. Thoughtful design resonates with people, and keeping a few basic principles in mind can make your dashboards more interesting and more effective:
- Use color sparingly and intentionally. I only used one color throughout my dashboard to draw attention to correct spellings. In the absence of other colors, the orange really pops out and helps draw viewers’ attention to the things I wanted to emphasize. Eva Murray has some additional tips about color usage in her recent Forbes article about the importance of color in data visualizations.
- Add familiarity and visual interest. While your dashboard may not have a place for sketches of Matthew McConaughey and Kim Kardashian, adding icons that complement your KPIs or having a familiar chart that anchors your visualization can help users orient themselves to the dashboard, providing context and clear entry points. And in a world where we are saturated with information, presenting it in an aesthetically pleasing way will make sure people don’t scroll right past it.
- Add padding. Then add some more. White space is imperative for dashboards with multiple charts. Without it, everything blends together, and it can be hard for your eye to find an entry point. By default, Tableau now adds four points of padding around charts, but I often use 10-40 points of padding around everything. Sometimes you don’t have the luxury of extra space, but when you do, try increasing the default padding. When you think you’ve got it right, add another five or 10 points just to see how it looks. I usually end up keeping the extra padding I add at the end.
- Make an intentional font choice. When Tableau added its own set of fonts in version 10, it was a game changer. And while those fonts are great, they can start to feel a little dull when everyone is using them. Adding a custom font, even if it’s just for your dashboard title, can set your dashboard apart or bring it in line with your organization’s brand. Unfortunately, most fonts won’t render properly when you publish to Tableau Server or Tableau Public, so you’ll need to upload them as images. I wrote another post about how to incorporate custom fonts using Microsoft Word, but you can also use PowerPoint to create images with transparent backgrounds.
- Incorporate interactivity. I added the spelling and grammar sections, so users had opportunities to engage with the dashboard rather than just view it. Adding dashboard actions is a great way to get users more involved in their analysis. Some of the new features Tableau is beta testing for version 2019.2 like parameter actions and hiding layout containers will offer new ways of incorporating interactivity, but that will only make it more important for developers to understand how to design a good user experience because these features can easily be misused. If you’d like to explore this further, my colleagues David and Carly led a webinar focusing on some strategies to design for data.
- Know your audience. It’s so basic that it almost doesn’t seem worth mentioning, but understanding your audience’s needs and interests is one of the most fundamental factors in making an effective dashboard. The content of my Reddit dashboard is broadly applicable, which makes it a good candidate for sharing on Tableau Public. The energy efficiency dashboard I’m developing has a much more niche audience (so, sorry … I won’t be sharing that one on Tableau Public!), but it’s very relevant to the group I’m working with. To ensure it has maximum impact, I’m constantly asking users questions to understand their needs, like what kinds of decisions they hope to make from the data, what comparisons they need, how granular they need the data to be, etc.
- Communicate a story. Dashboards shouldn’t feel like a data dump or a random collection of facts. They should be organized with a sense of flow and hierarchy. What’s important for users to see first? What context do they need before they dive into their analysis? What questions will a chart raise, and what information will users need next to answer those questions? Keeping questions like this in mind while you design your dashboard will help you organize it in a way that flows logically and provides a smooth experience for viewers.
Ok … enough of the serious stuff. Now for some fun.