The point of the #MakeoverMonday project is to take an existing data visualization and improve it. But how can you improve anything that “The Economist” creates? They have such a knack for breaking down complicated topics into clean, clear and concise visualizations. So, when I saw that Week 31’s challenge was to makeover charts related to their Big Mac Index, I knew I was in for quite a challenge.
My original idea was to show a table with local Big Mac prices, dollar equivalents and percentage over-/under-valuation, along with a sparkline to show historical currency valuation. I love the way FiveThirtyEight uses highlight tables to draw attention to certain values and patterns in tables (there is a great example in their recent article about mid-term elections), so I started with that. But by the time I got 42 countries in there, each with three different values and a trend line, things looked pretty overwhelming.
So, I started scaling back.
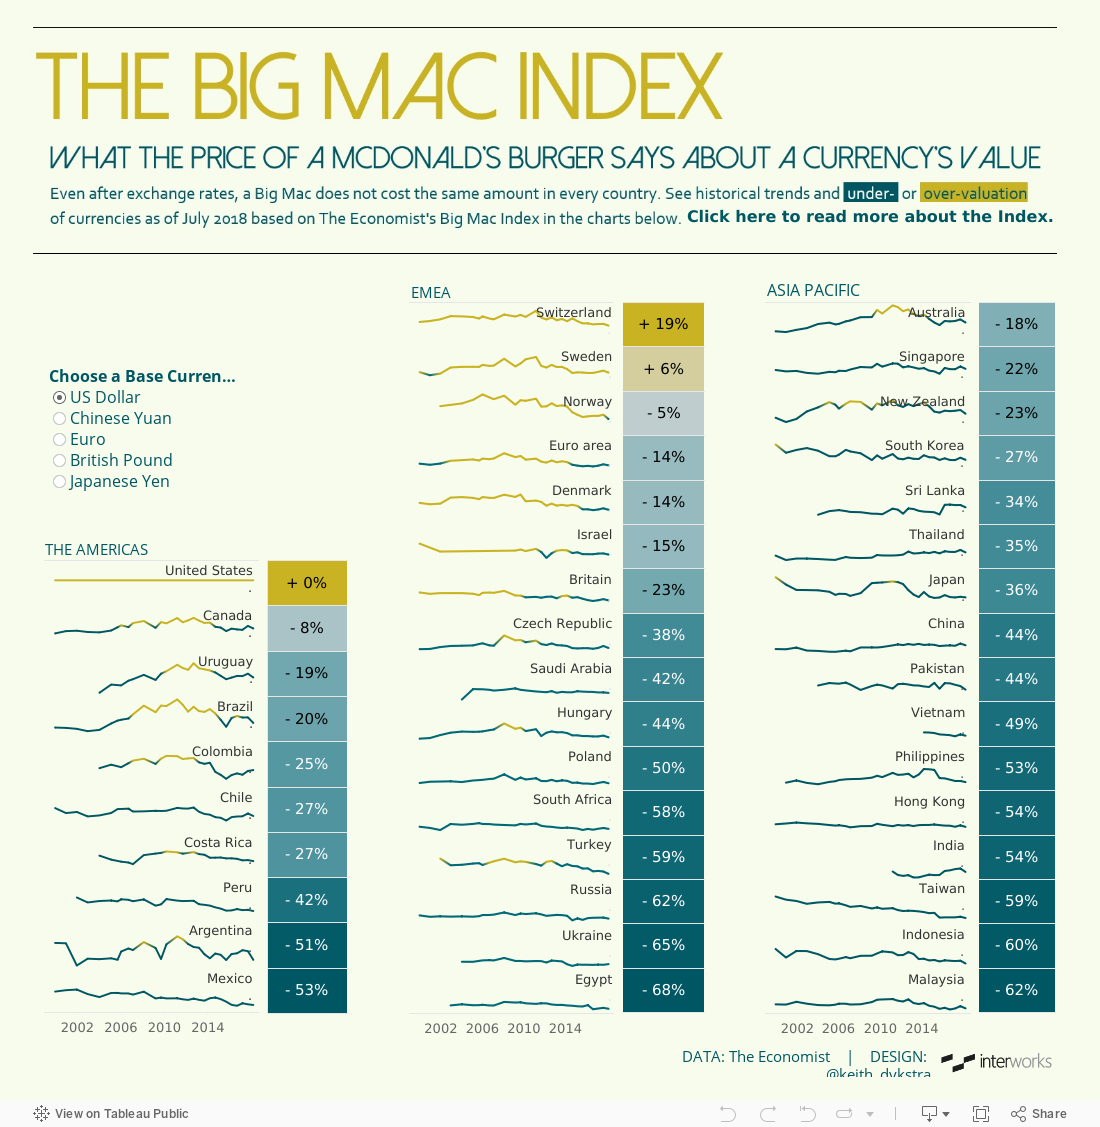
Figuring that the most important number was the percent over-/under-valuation, I stripped out the local prices and dollar equivalents, leaving just a highlight table and a sparkline for each country. I added in a parameter that allowed users to change their base currency and then inserted a link to “The Economist’s” original article into my header for people who wanted to learn more. After applying some visual styling inspired by the menus at Ferris, a restaurant in NYC, I ended up with this: