
As Dave Sirey recently wrote about it, “Funnel charts are a great way to track progress through a workflow with multiple steps. They can highlight how well a process is being followed and easily identify any bottlenecks. You can even use table calculations to look at different ways to measure progress to each step (percent of total, percent change, etc.).”
Dave highlighted two ways of making funnel charts in that blog post (stepped and smooth), and I’d like throw in one more funnel chart that I recently used, which I’m calling the “shape funnel.” After that, I’d also like to discuss how I decide which one to use in a particular dashboard.
As I was recently working on a project, I had widely varying values in each of my tiers, but I didn’t want to see those relative differences. I just wanted to see each tier of the funnel (really, on my notepad I wrote “upside down pyramid”– you all get where I’m coming from).
So, I had an idea and opened up PowerPoint.
Wait … PowerPoint?!
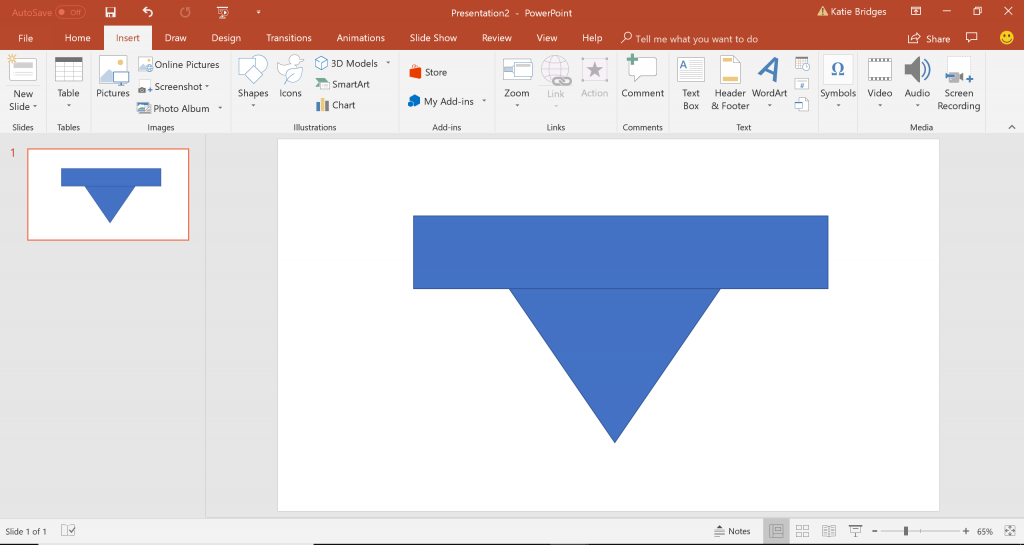
Yep. In PowerPoint, I created a “funnel” of sorts. I did this by adding in a triangle shape and then putting a rectangle on top where I wanted the first tier of my funnel to be. I duplicated that until I had the same number of rectangles as the number of tiers I wanted in my dashboard. After I figured this out, I actually created three different “funnels” with a different number of tiers.
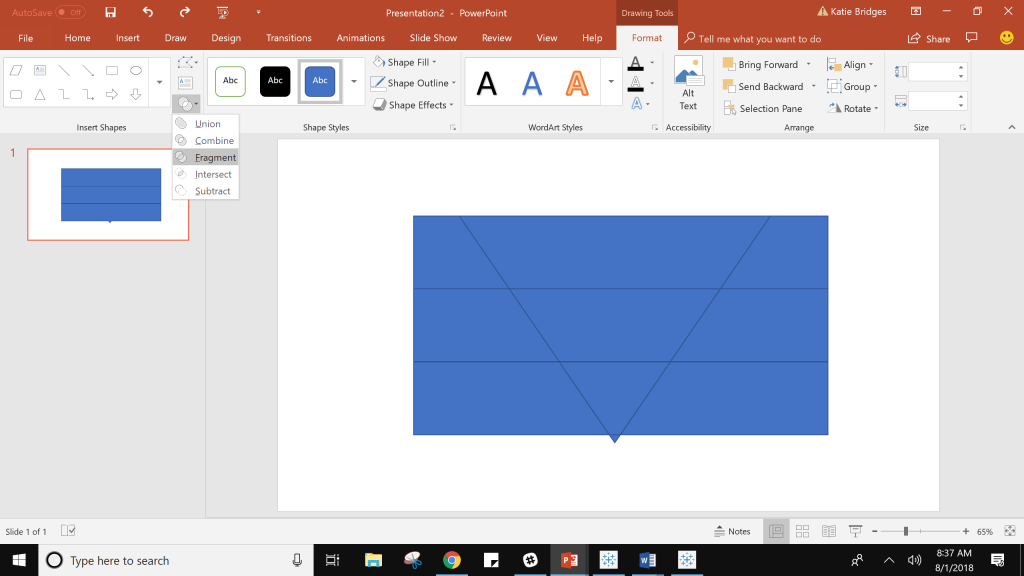
As you do this, you’ll want to make sure your rectangles are not overlapping. Next, in the Format pane of PowerPoint on the Shapes menu, you’ll see an icon that looks like a Venn diagram. Click that and select Fragment. You can see below what mine looks like:
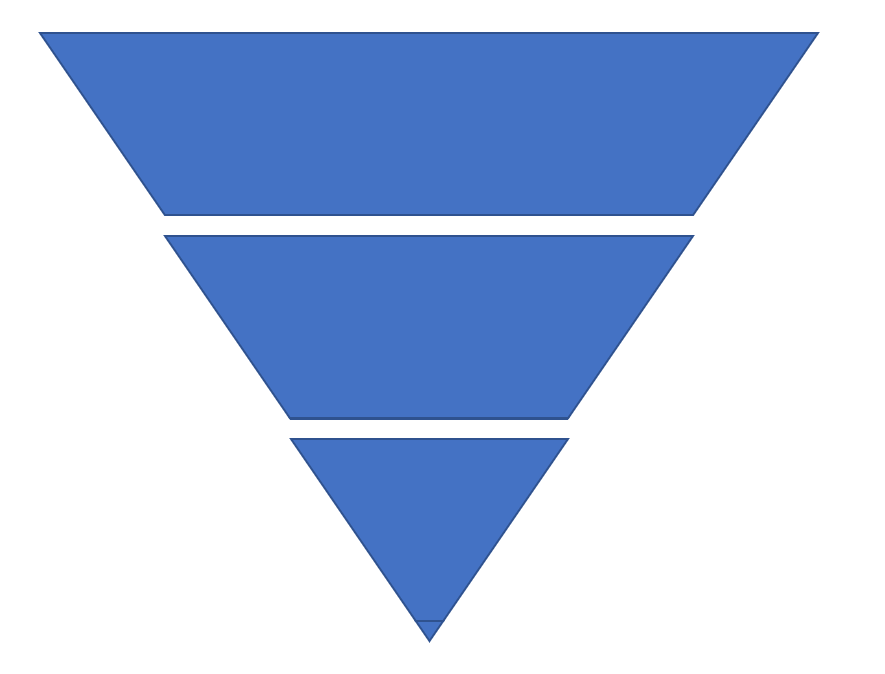
I then deleted the rectangle sides and combined the bottom tier with the triangle tip, so I was left with what looks like a funnel:
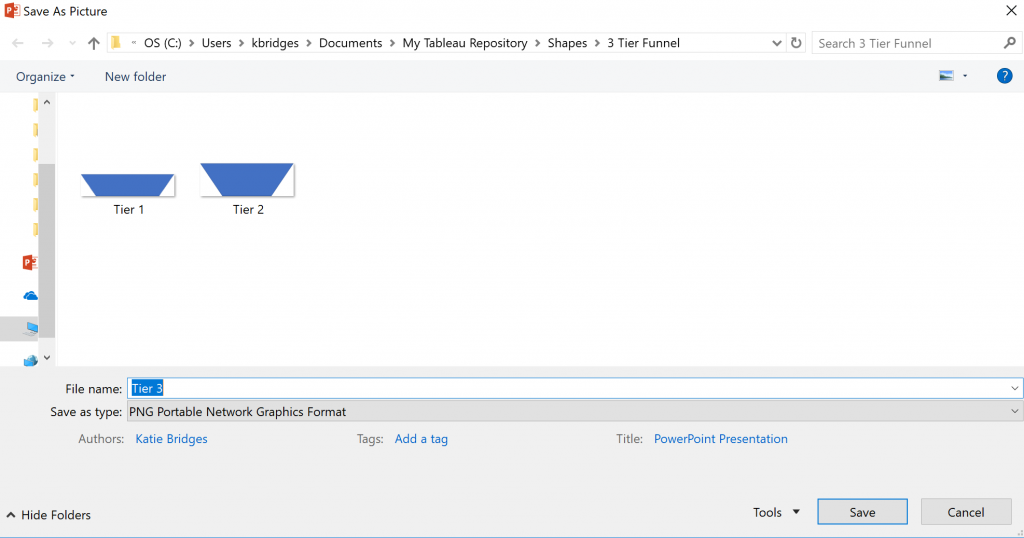
Next, save each of those pieces as a .png image in the Shapes folder in My Tableau Repository. Pro tip: Name them such that you’ll be able to know what each tier is in Tableau (I named the top tier “Tier 1,” all the way down to the bottom “Tier 3”).
Now, Back to Tableau!
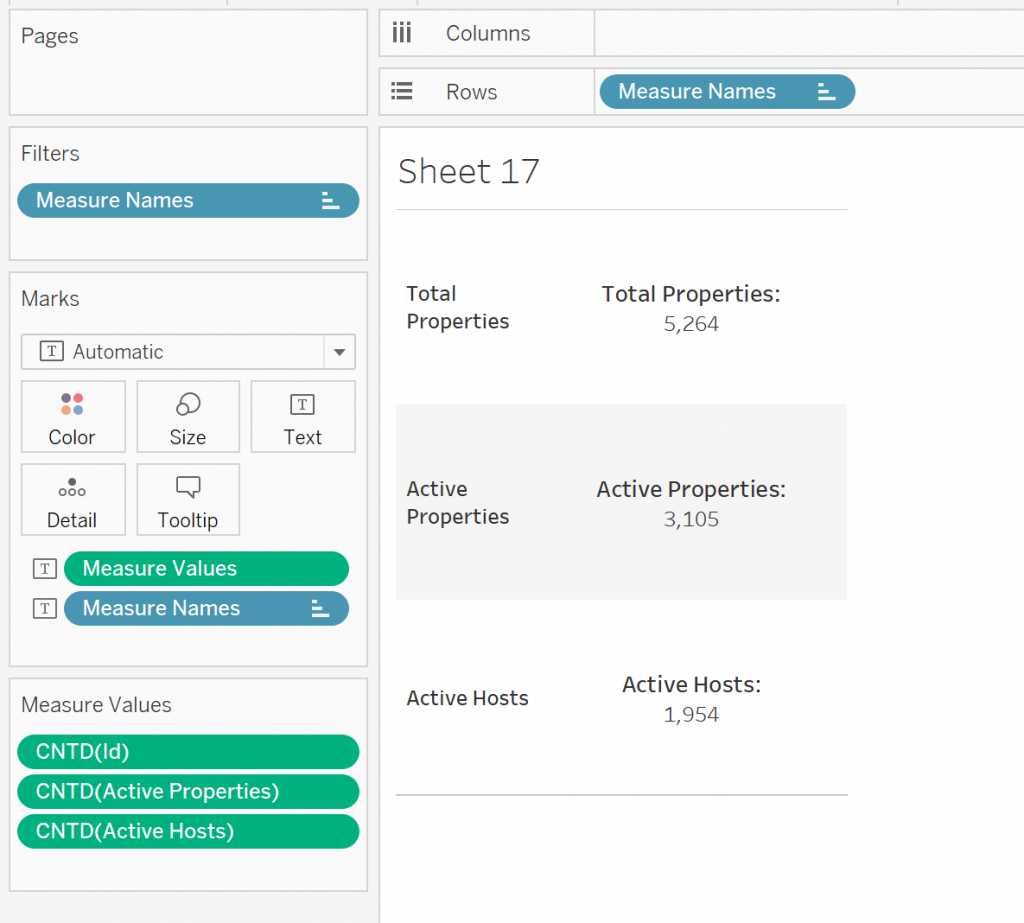
In the dataset I’m working with, I’m looking at Airbnb data in New Orleans (viz coming soon!). My goal was to show the total number of properties as my top tier, the number of active properties (those who had been reviewed in the last month) and then the number of hosts at those active properties.
To do this, I used Measure Names/Measure Values to get these metrics set up as text. I also edited the aliases of my measures and did some label formatting (click on Label on the Marks card and then that ellipsis):
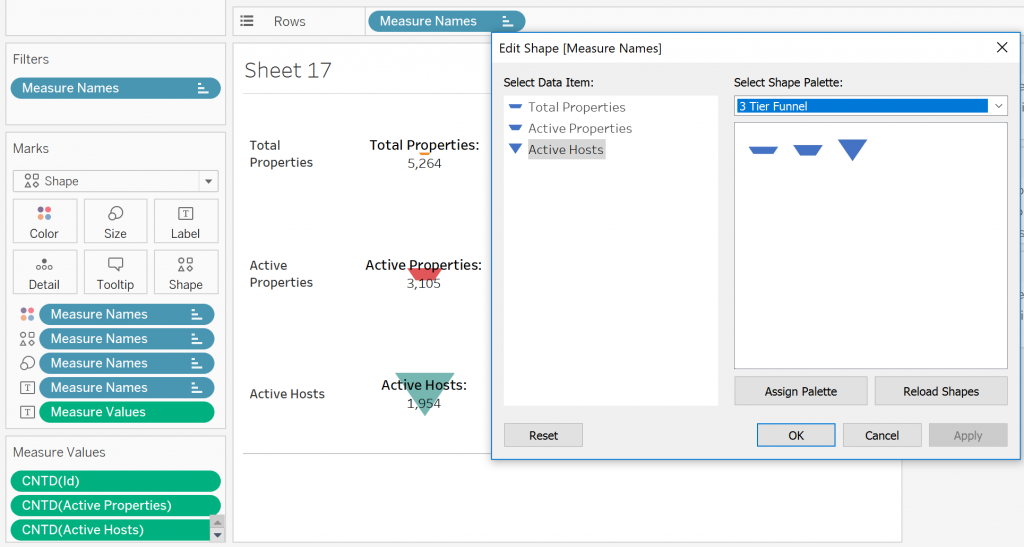
Alright, now time for the magic! Change the Mark type to Shape. Bring Measure Names to Shape, Color and Size. Change your shape palette to the tiers you made (if you don’t see them, make sure to click Reload shapes).
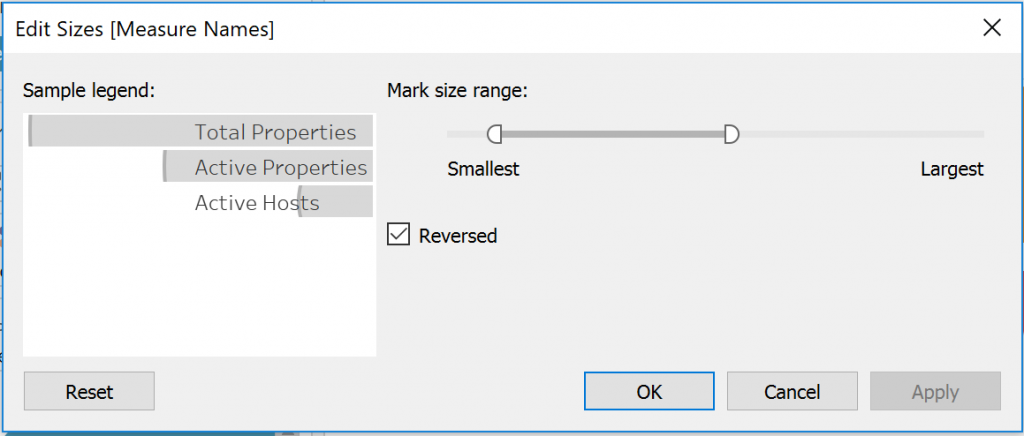
We’re almost there! You’ll notice our sizes are backward and the funnel isn’t sized quite right. On your Size legend, click on the top right-hand corner and choose Edit Shapes. Check the box for Reversed.
Next, click on Size on the Marks card and increase until you’re happy with the size of your funnel:
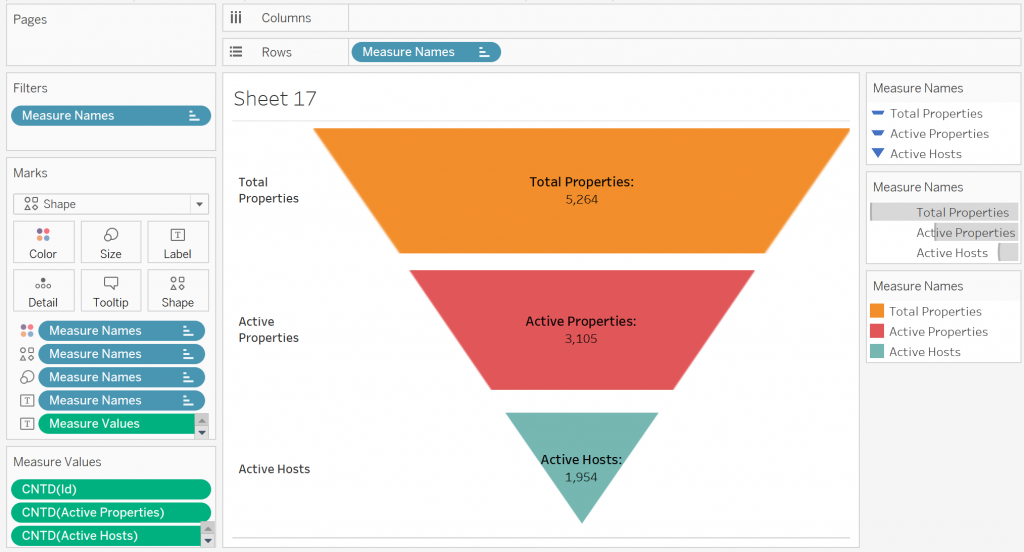
I hid the Measure Names row headers by clicking on Measure Names on Rows and selecting Show Headers.
Now, I’m ready to use this sheet in a dashboard!
Which Funnel to Use?
You may be thinking: How do I know which of these three funnels (Dave’s stepped funnel, smooth funnel and the shape funnel above) do I use?! Nobody needs the anxiety of cereal shopping in their dashboard making (SO MANY OPTIONS!). Below are some of the questions you should consider before deciding on a particular funnel type:
- Do you want to see the relative size difference of each step of the funnel to one another?
- Yes: If the first tier of the funnel is substantially larger than the second and you want to see that actual difference, then you should definitely consider the smooth funnel or stepped funnel. Both of these are sized on a measure, so the size of each funnel tier will allow users to see trends like exponential growth or increasing rate of change.
- No: If you’re worried that showing the relative size may cause some unanticipated looking funnels (i.e. a “bulge” if a middle tier is higher than the tiers below and above; a tier that has a very small output and may be really hard to see comparatively), the shape funnel above is a great option. The shape funnel will allow you to see all five stages, and the size of those is actually on a dimension – tied to the place it falls in your process rather than the actual value of that tier of the funnel.
- Are you incorporating parameters or filters that may change the number of levels in your funnel?
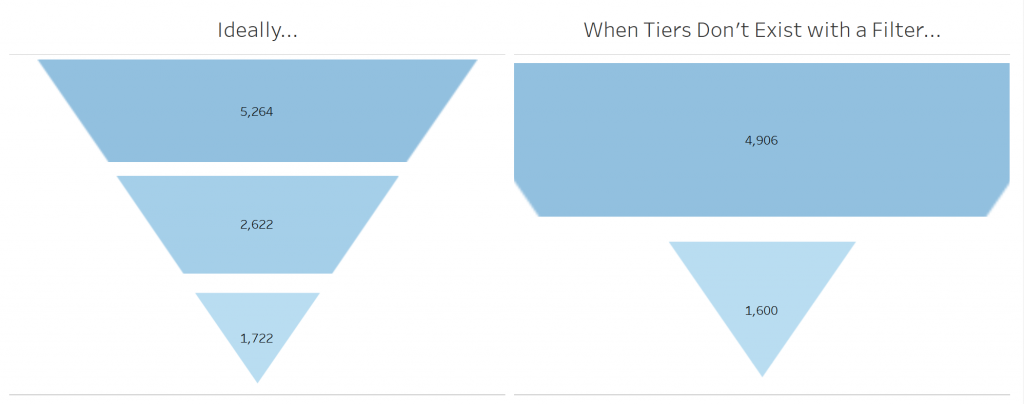
- Yes: Let’s say we are looking at the supply chain flow for different products we make. Overall, all of the funnels look awesome. However, if we filter by a specific product where some of the funnel tiers don’t exist, the shape funnel may not always play nice (see picture below). If this is the case, I’d recommend sticking with the smooth or stepped funnel.Disappearing funnel tiers:
- No:
- Want to have a dashboard that you’re not adding any interactivity to that you can reload data into and just export as a PDF or that you’re using in a PowerPoint or another application every month? All of them will work, but I’d recommend the shape funnel because you know it’ll look the same month after month – it’s just the overall numbers that are changing.
- If you want to look at hiring pipeline across each department but you still know each department has at least one candidate at each stage, you get complete creative freedom – all of them will work. Refer to the other two questions to best decide which funnel.
- Yes: Let’s say we are looking at the supply chain flow for different products we make. Overall, all of the funnels look awesome. However, if we filter by a specific product where some of the funnel tiers don’t exist, the shape funnel may not always play nice (see picture below). If this is the case, I’d recommend sticking with the smooth or stepped funnel.Disappearing funnel tiers:
- Do you want interactivity with the funnel, i.e. someone to click on a particular stage of the funnel and filter the rest of the dashboard?
- Yes: In order to trigger an “action” in Tableau, folks have to click on the Mark type. Since the shape funnel and the stepped funnel both use shapes, these are ideal for triggering actions. The smooth funnel will work as well, but it may be a little bit more difficult for user interaction. Because the funnel is really two area charts, when a user clicks on a certain member of a dimension, one side of the area chart will highlight to demonstrate the selection, which could lead to confusion on the part of the user. See asmooth funnel chart when clicked to trigger an action below:
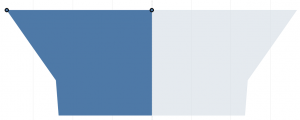
- No: If you don’t want any interactivity, all three funnel charts will work and you can again refer to the previous two questions to determine the best type for your use. One quick note here though: If you don’t want an accidental selection of a piece of your funnel (as shown above), you may want to float a “blank” object on top of the funnel so your users don’t accidentally click.
- Yes: In order to trigger an “action” in Tableau, folks have to click on the Mark type. Since the shape funnel and the stepped funnel both use shapes, these are ideal for triggering actions. The smooth funnel will work as well, but it may be a little bit more difficult for user interaction. Because the funnel is really two area charts, when a user clicks on a certain member of a dimension, one side of the area chart will highlight to demonstrate the selection, which could lead to confusion on the part of the user. See asmooth funnel chart when clicked to trigger an action below:
Overall, all three of these funnels are awesome options. Now that you’ve got several to choose from, figure out which one best fits your use case and get to funnel making!
