One of the easiest-to-use diagnostic and troubleshooting tools we use here at InterWorks when working with Vertica clusters is Tableau. Vertica tracks a vast amount of information about cluster and database status. Diving into that data and quickly building visualizations and dashboards from these system tables can be very useful for system and database administrators. However, when connecting to a Vertica database, Tableau does not show any tables/views from the v_catalog or v_monitor schemas. To build visualizations from these schemas, you can either use a custom SQL data source, which can work fine but is a bit more time consuming, or you can use the following alternative.
Instead of using custom SQL, we’ll set up a schema to house views to all of the Vertica system tables. Since this will be a user schema, Tableau will show it and all of the views within it as available options for selecting a table for your data source. In our example, we’ll use the “vert_sys” schema name, but you could name it anything you’d like.
First, we’ll run the following two commands on the Vertica cluster itself. The first will create the “vert_sys” schema. The second command will build a list of “CREATE VIEW” statements, which it will then pipe back to another vsql process for execution. You should see many “CREATE VIEW” lines as output as Vertica creates each view. Be sure to modify the “-U” and “-w” parameters to use the username and password for your database.
vsql -U dbadmin -w password -c 'CREATE SCHEMA vert_sys'

vsql -Atq -U dbadmin -w password -c "SELECT 'CREATE VIEW vert_sys.'||table_schema||'_'||table_name||' AS SELECT * FROM '||table_schema||'.'||table_name||';' FROM v_catalog.system_tables" | vsql -U dbadmin -w password
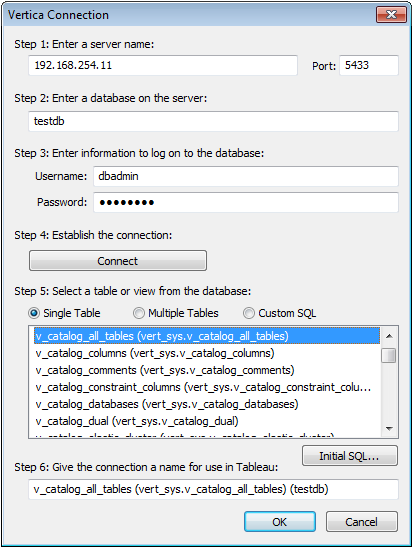
After doing this, you should notice when creating a connection in Tableau, that views to all of the different system tables are now available:

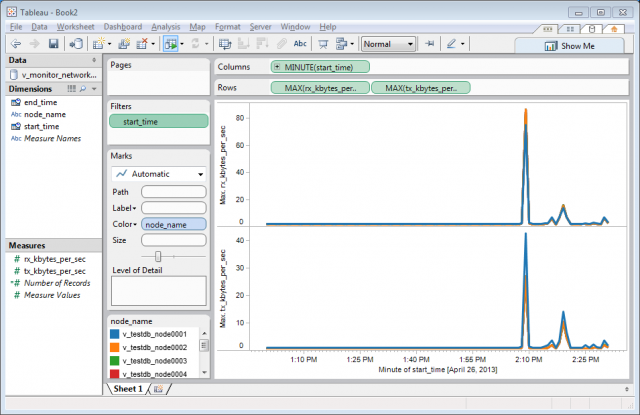
From here, you can easily select any view and quickly begin building a visualization using a Vertica system table. Here’s a quick example of a visualization built from the v_monitor_network_usage view that we’ve created, showing network send/receive bytes by node:

Note About Upgrading Vertica
Remember, when upgrading Vertica, new system tables may be added and others may be dropped. You may need to drop your newly-created “vert_sys” schema and recreate it using the commands above to get views for the latest set of system tables.
