
Please note that Portals for Tableau are now officially known as Curator by InterWorks. You can learn more at the official Curator website.
Are you as excited as I am for Tableau Extensions? Probably not. I’m pretty excited. I already wrote a blog post about it. Unfortunately, Tableau Public doesn’t support them yet (at the time I wrote this post) and you need Tableau Server 2018.2+ to host them, which many haven’t adopted (at the time I wrote this post). Fortunately, one of my favorite Extensions has an API that makes it possible to use in Portals for Tableau! I bet you can already guess which one it is considering the title of this post: Wordsmith by Automated Insights!
Using Wordsmith in Tableau Portals
Wordsmith takes your data and automatically generates a narrative to explain that data. There are some big use cases here that have major value proposition. For instance, the Associated Press used this software to increase their report generation by twelvefold! For other customer stories, check out Automated Insight’s website. When the Tableau Public and Server versions that can use Extensions are more widely available, you can have this increase in efficiency in your reporting without touching a line of code. In the meantime, however, this post will walk you through how to use their API to generate narratives on your portal!
Before you get started, make sure you have Tableau Desktop, Tableau Server, Portals for Tableau and an account with Wordsmith. If you don’t have those things, feel free to continue reading to get an idea of the possible benefits for your business! You’ll also need some JavaScript knowledge because we’ll be using Tableau’s JavaScript API and for the REST API call to Wordsmith.
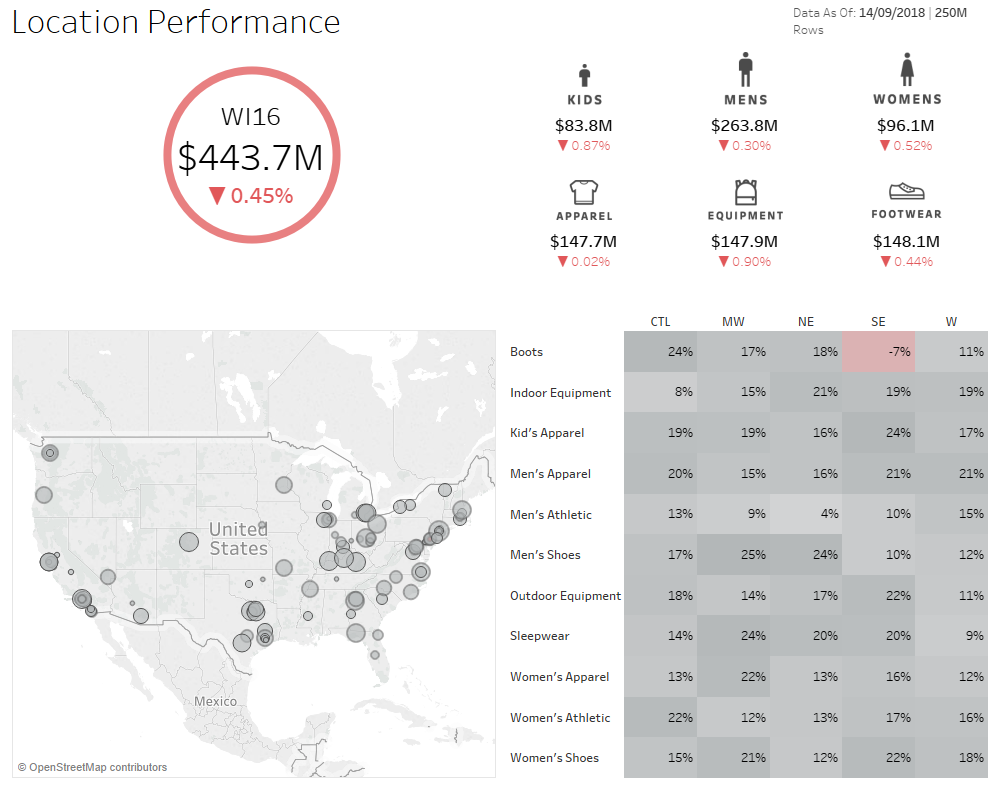
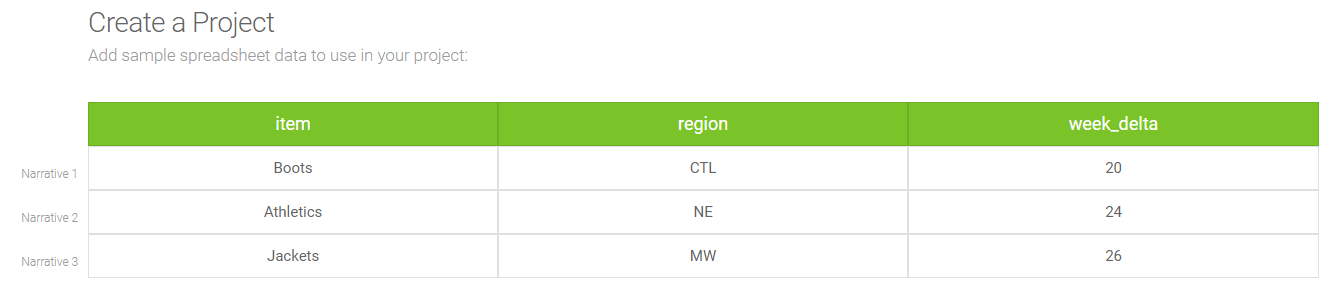
To begin, you must have a dashboard on your portal from which to grab data. The dashboard below is the one I’ll be using for this demo:
 Get the dashboard published to your Tableau Server that is connected to your portal. To upload a dashboard, navigate to the backend of your portal instance, choose Content (from the top menu) then choose Dashboards (from the left menu) and click the blue New Dashboard button.
![]()
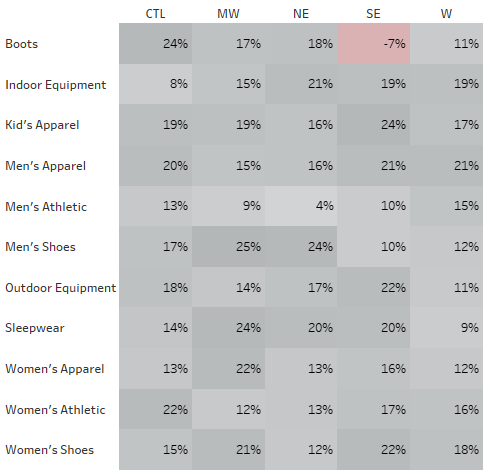
Choose the Site, Workbook and Dashboard that will be used with Wordsmith. Once your dashboard is uploaded to the portal, we can choose some data to serve as the basis of our narrative. I selected the crosstab on the bottom right of the dashboard.
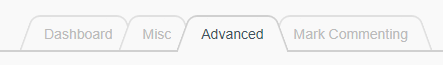
I wanted to make my narrative update on each mark selection with the summary data from that mark. That means it’s JavaScript time! Navigate to the dashboard settings and choose the Advanced tab:
From there, scroll to the bottom where you can enter a JavaScript snippet that will be run on the OnFirstInteractive event, which is when the dashboard is fully loaded:
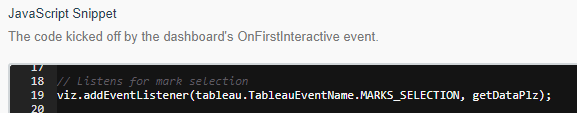
First, we must establish an event listener that will trigger on the specified event, like mark selection:
viz.addEventListener(tableau.TableauEventName.MARKS_SELECTION, getDataPlz);
The viz object is referring to this Tableau instance, the tableau.TableauEventName.MARKS_SELECTION is a constant that lets the event listener know what event to listen for. The getDataPlz is a custom function I’ll show you next that actually returns the data. To get an in-depth explanation on each piece of this code, you can go to Tableau’s JavaScript API Reference.
Now, let’s write the function that runs on each event occurrence being listened for to get the summary data from the marks. The primary method we need to use is the getSummaryDataAsync() that is for the Tableau Sheet object. We know we have the viz object already, so let’s use that to drive down to the Sheet object we need. A quick way to see the list of sheets within the viz is this:
console.log(viz.getWorkbook().getActiveSheet().getWorksheets());
What we are doing is getting the workbook related to the viz, then the active sheet (which in this case is the whole dashboard), then the list of worksheet titles (that are within the dashboard) and printing it to the console. You need to put this in your function referenced in the event listener (mine is getDataPlz). Like this:
function getDataPlz() {
            console.log(viz.getWorkbook().getActiveSheet().getWorksheets());
}
Once you save the dashboard settings and go to the frontend, you can use the Inspector tool from your browser to inspect the console (CTRL + SHIFT + I for Chrome). After selecting a mark and triggering the event listener, I can see from the returned array that the fifth worksheet is my targeted crosstab. We can now add the line of code that will return the summary data:
function getDataPlz() {
sheet = viz.getWorkbook().getActiveSheet().getWorksheets()[5];
sheet.getSummaryDataAsync(options).then(function (table) {
                        var data = table.getData()[0];
                        console.log(data);
            }
}
We assigned our previous line of code with the index of our target worksheet to a variable to be able to operate on. Then we used the getSummaryDataAsync() method to get the data itself. The parameter, options, is an array of parameters that chooses how to get the data. The options variable was created above the getDataPlz function and looks like this:
options = {
  ignoreAliases: false,
  ignoreSelection: false,
  maxRows: 0
};
We chose to not ignore aliases or the selection and set maxRows to 0, which returns all the rows. In this case, there’s only one row because we’ll only be selecting one mark, so setting this to any number would have the same result.
The getSummaryDataAsync(options) method returns a promise that you can then write a function on that gets and returns the data. The promise is for a data table (which I called table). The data table class has a method called getData() that returns a two-dimensional array: the first index being a row index and the second being the column index. Our call is simple because there’s only one row of data. We then logged that data to the console to see what we got:
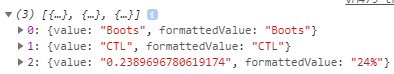
Now that we know what the summary data looks like, let’s assign it to some variables.
var data = table.getData()[0];
  var item = data[0].formattedValue;
  var region = data[1].formattedValue;
  var week_delta = data[2].formattedValue;
Creating the Narrative
These variables can be used to create a body of JSON text to use in our Wordsmith API call. Before we do that, let’s create our narrative! For a detailed look at Wordsmith’s template structure, read this blog post. To get started, go to Wordsmith’s site and choose to create a new project. You’ll be given a 3×3 table to create a basic schema. Give each column name a data point from your mark selection (if there are more than three, we can edit this later), give some sample data and hit create project.
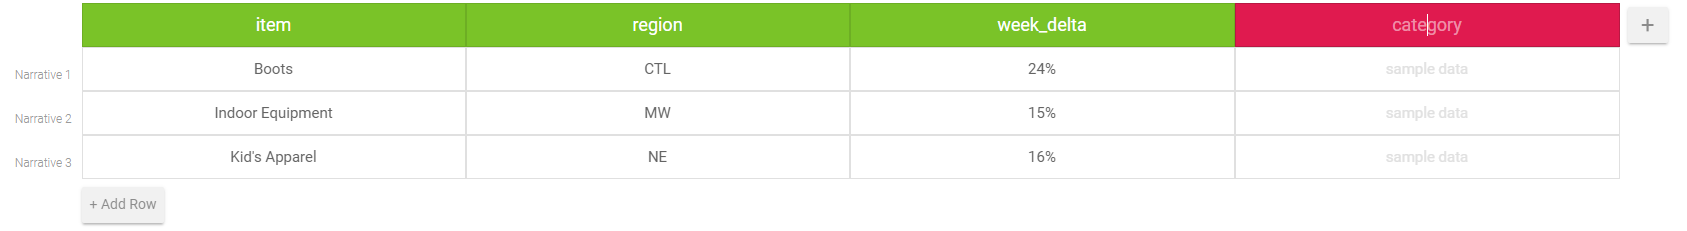
If you need more columns, navigate to the Data section from the left menu and choose the + button on the right to add columns. The data from the rows doesn’t have to be real for this use case—only the data types. This use case is getting data from the Tableau worksheet, so the Wordsmith backend doesn’t need any real data.
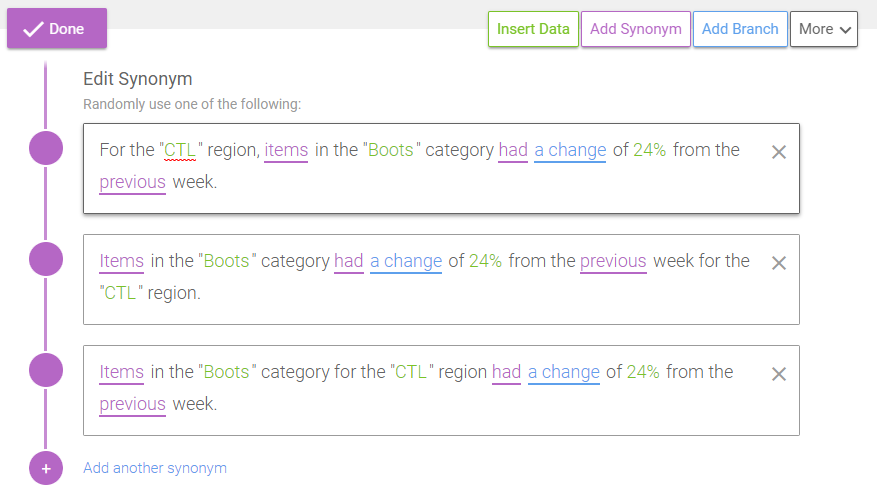
I created a simple sentence with a few synonyms, branches and data references to get a natural-feeling narrative:
Connecting Wordsmith to Your Portal
Next, let’s connect Wordsmith to our portal. The API call for Wordsmith for generating narratives looks like this:
https://api.automatedinsights.com/v1.8/projects/*your-project*/templates/*your-template*/outputs?access_token=*your-access-token*
You can find your access token by going to the Wordsmith dashboard and navigating to the API Access page from the left menu. Obviously, having your access key visible from your JavaScript isn’t ideal. Fortunately, Portals has an API Relay feature! This is so you can set up your RESTful settings on the backend to hide classified access tokens. To enable this feature, go to your portal backend and navigate to Settings from the top menu. Choose Portal Settings on the left menu, then go to the Features tab and enable Integration under the Functionality section. After a page refresh, you should see the Integration menu item appear at the top of the page. Select that menu item, and navigate to the API Relay setting on the left. Here, you can select the New API Relay button and start configuring.
I named my relay Wordsmith. For the URL, put in the endpoint noted above (except with your project and template names and your access token). For the Request Headers, make one named “content-type” with the value “application/json.” Wordsmith requires a User-Agent Header, so create one and put your name or your company name as the value. When you POST on this endpoint, Wordsmith expects to receive a body of JSON encoded text. To accomplish this, we skip the Constants and only create one Request Variable. I named mine “data” and turned on the JSON Body option. Now, save your relay and refresh the page. Scroll to the bottom and copy the relay’s link. We’re so close now!
To get the narrative onto the page, the first thing we do is use JavaScript to inject some HTML into the page. If you need a tutorial on this, check out this W3Schools tutorial. Then, we create an XMLHttpRequest object, like so:
var xhttp = new XMLHttpRequest();
xhttp.onreadystatechange = function() {
  if (this.readyState == 4 && this.status == 200) {
    var narrative = JSON.parse(this.responseText).msg.data.content;
    document.getElementById("wordsmith-node").innerHTML = narrative;
  }
};
This is pretty standard code for making a REST API call in JavaScript. I prefer this method, but you can also use jQuery here since it’s already imported within Portals. The narrative variable we created grabs the returned JSON, parses it and drills down to the actual narrative. This is based on how Wordsmith’s response is formatted. Then, we edit the inner HTML of the injected HTML from before with the narrative from Wordsmith. Next, the entire code to make the call with our relay looks like this:
var json_data = `
  {
    "data": {
      "item": "` + item + `",
      "region": "` + region + `",
      "week_delta": "` + week_delta + `"
    },
    "proofread": true
  }
`;
xhttp.open("POST", "https://portaldemo2.interworks.com/api/v1/integration/apiRelay?api_relay_id=1&data=" + json_data, true);
xhttp.send();
The json_data variable is the format Wordsmith expects when receiving the data used in the narrative. The data array has key-value pairs for each data point. In this example, the variables we snagged from the Tableau API call from before is what we used in the JSON call. When proofread is set to true, it will return valuable information if our call doesn’t work. We then open our XMLHttpRequest object with our API relay link and append the JSON data text. With all the settings already configured within the relay, we can simply send our request.
The Final Product
BOOM. With some styling on the injected HTML, you can have some beautiful narratives automatically generated upon mark selection within your Portal instance! You can increase the splendor of this feature by building out the Wordsmith narrative more, adding some cool styling to your injected HTML or even adding more Tableau event listeners that get data from other worksheets within the dashboard!
With this process requiring some JavaScript knowledge, I’m certainly looking forward to Extensions being more widely accessible. That way, anyone can create narratives to enhance their Tableau dashboards. In the meantime, you can always utilize some code. If you have any questions about the software platforms used or if these solutions are right for your business, feel free to reach out to us. We’d love to help!