
Please note that Portals for Tableau are now officially known as Curator by InterWorks. You can learn more at the official Curator website.
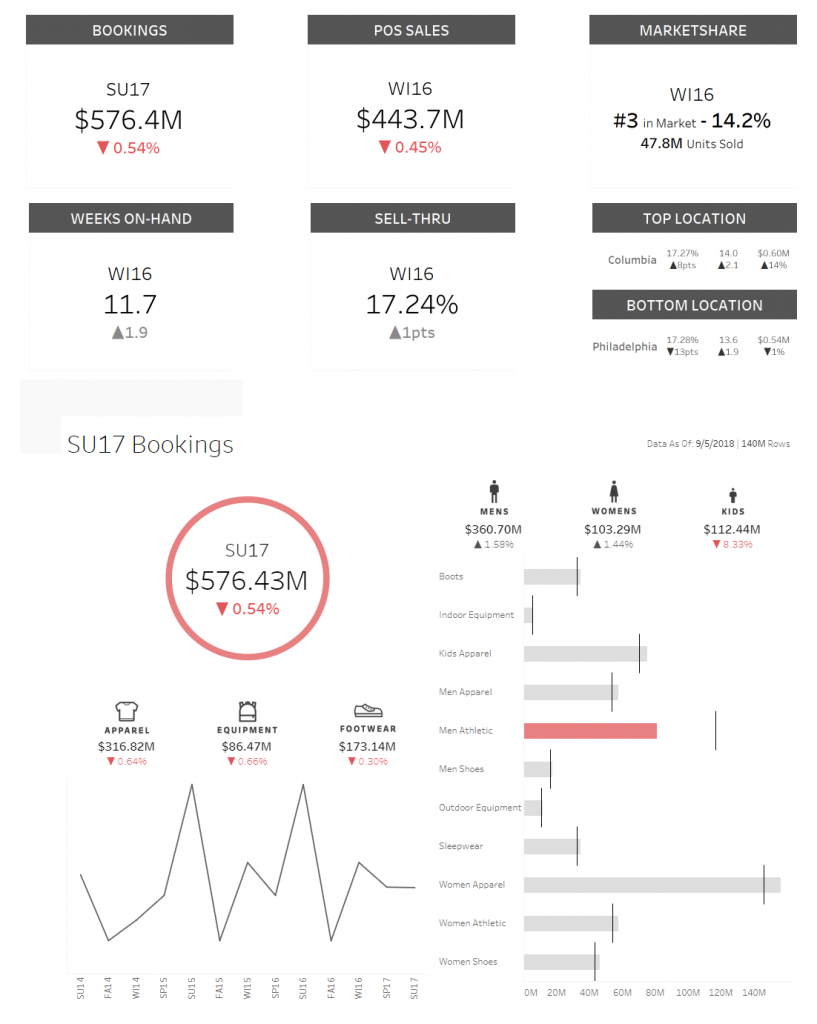
Scorecards are used to observe KPI’s over time, are incredibly valuable for real-time business insights and are available for use in Portals for Tableau! This post will go into how to create the example below:
Before you begin, make sure you have Tableau Desktop, Tableau Server and Portals for Tableau. If you don’t have those things, feel free to continue reading to get an idea of the possible benefits for your business!
How It’s Done
First thing’s first, you must create the dashboards in Tableau. We won’t go into every specific styling aspect of these dashboards, but we’ll certainly cover the necessary ones to create our scorecard. We wanted to have six thumbnails that will each bring up a dashboard revealing metrics for our (made-up) clothing company. One of those dashboards involve the number of bookings made per season per year:
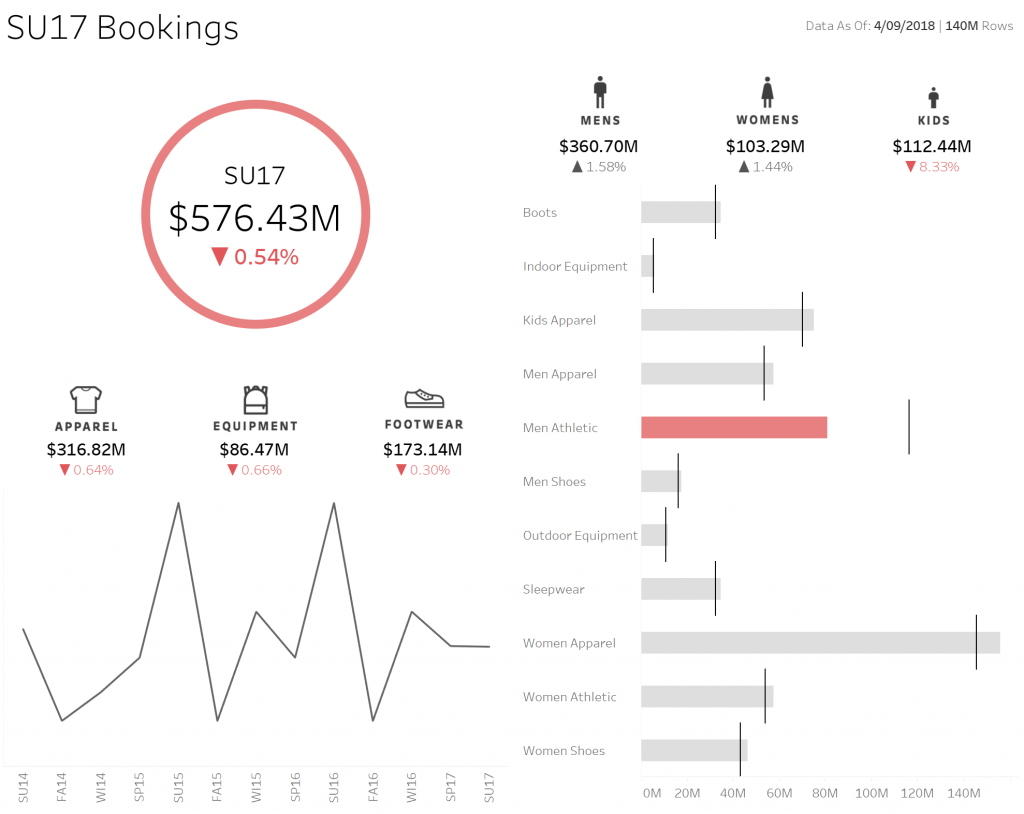
The contents of this dashboard are great examples of visualizations you might want to include in your company’s version. Some notable features are the red marks contrasted with the grey to quickly denote problems needing to be addressed, the line chart showing where bookings are at relative to the season in previous years, and the date on the top-right that shows how fresh the data is.
For each dashboard, we must create a second dashboard that will act as a dynamic thumbnail for the scorecard. The example for bookings looks like this:
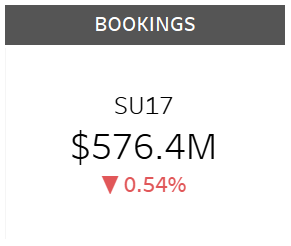
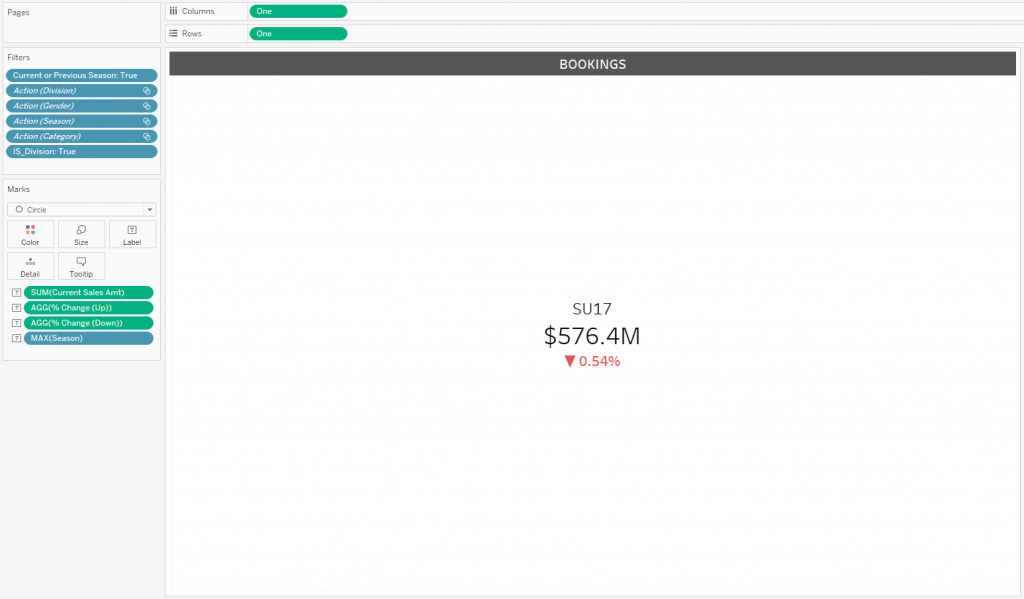
To create this view, create a donut chart but leave out the step that colors the marks, leaving only the information in the middle (the donut hole?). Then, create a parameter that is simply the value 1 and use it for the columns and rows. This will center the data horizontally and vertically. After formatting the header, you should have something like this:
Finally, create a dashboard that only includes this sheet. Set the minimum size to 300px by 200px and the maximum size to 300px to 250px. You can add two sheets like we did for top and bottom location, but be sure to keep the minimum and maximum sizes for the dashboard the same. Repeat for each dashboard you would like included in your scorecard. Publish all of these dashboards (twelve for us) to your Tableau Server.
We’re almost there! Connect each dashboard to your portal instance by going to the Content menu (in the top menu), then navigate to the Dashboards section (from the left menu) and select the blue New Dashboard button:
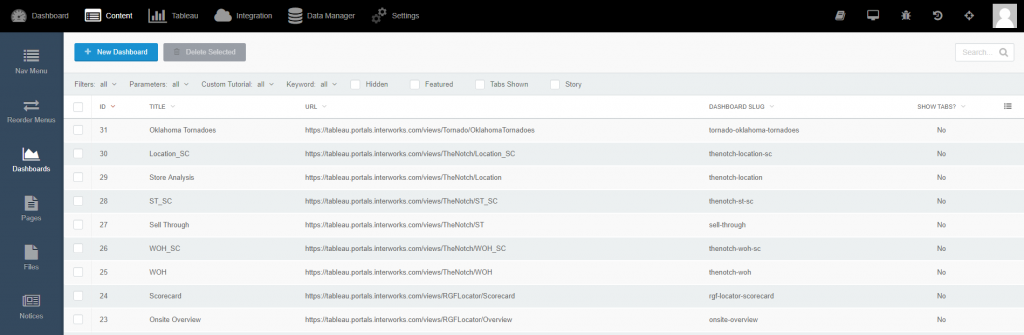
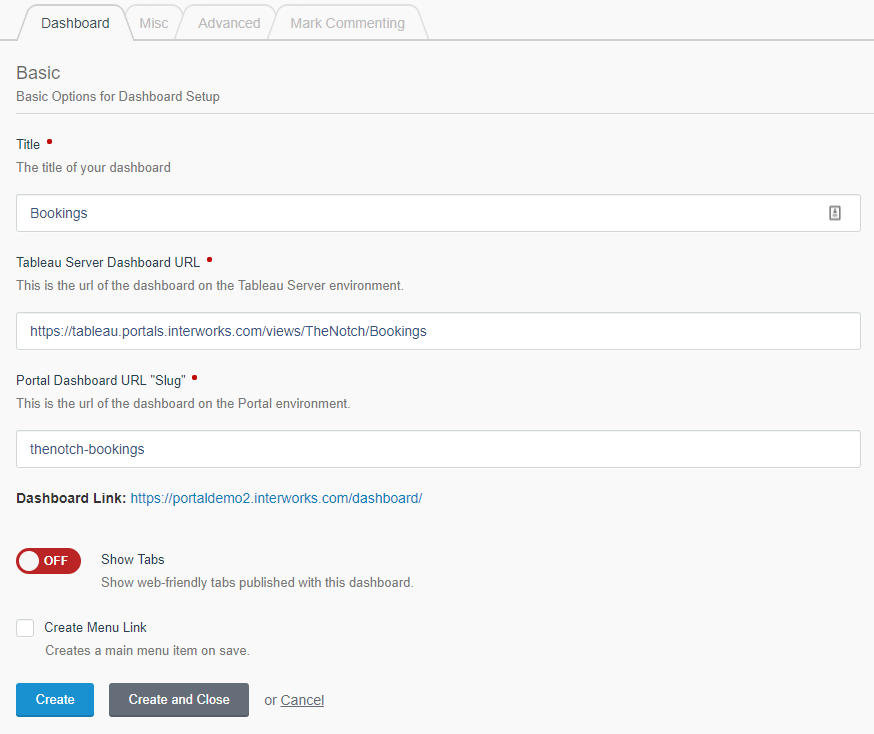
Here you will choose which site, workbook and dashboard from your Tableau Server to connect to. The Title, Tableau Server Dashboard URL and Portal Dashboard URL “Slug” will all be automatically filled. Uncheck Create Menu Link (unless you want each dashboard to have their own menu link):
You can move through the other tables to include a thumbnail, decide whether the dashboard should be featured on the homepage, add custom JavaScript snippets that trigger on interaction, add inline mark commenting and set other embedded dashboard features. Once you have each dashboard added and set up to your liking, navigate to Settings (on the top menu), then to Portal Settings (on the left menu). Go to the Features tab and make sure Scorecards in the Functionality section is turned on.
Next, navigate to the Tableau settings (on the top menu), then to Scorecard menu (on the left menu) and click the New Scorecard button. Give the scorecard a title (ours is “scorecard”) and make note of the automatically generated URL slug – we’ll need that later. Select Add new item and choose the “thumbnail” version of your dashboard for the Card and the dashboard itself for the Dashboard.
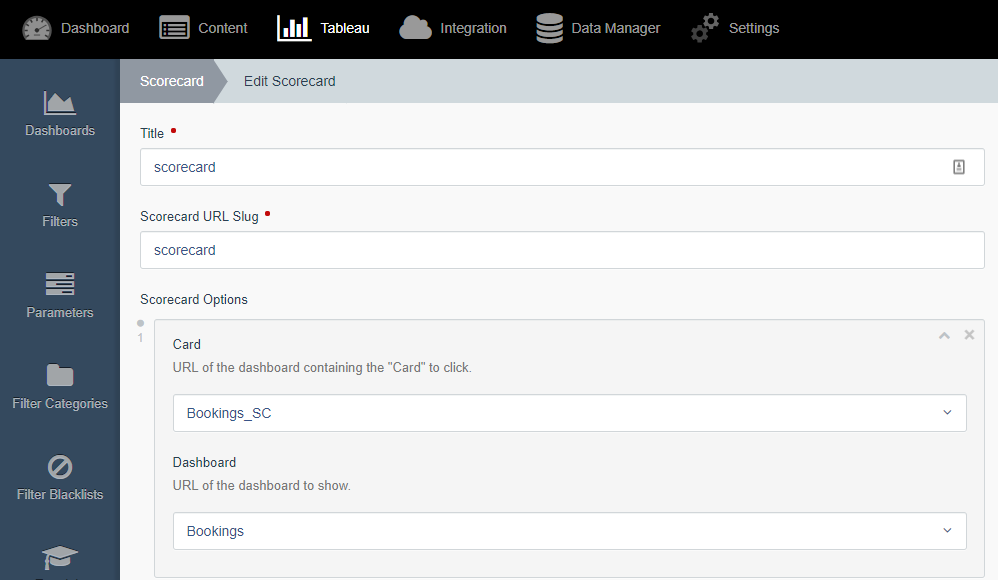
Note that our naming convention made it easy to find Bookings and its related card (same name trailed with “SC” for scorecard).
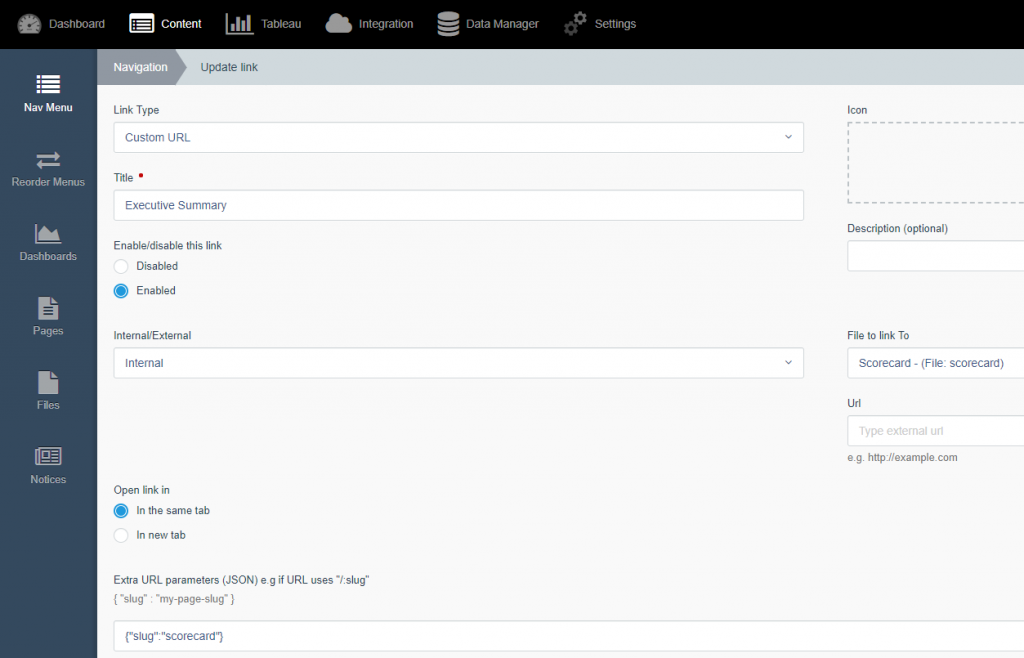
At this point, the scorecard is not displaying so we must create a menu link for it. Navigate to Content (on the top menu) and your navigation menu settings should be there. Click the New Menu Link button and select Custom URL for the Link Type. You can title the page that will display the scorecard whatever you like. We chose “Executive Summary.” Select the Scorecard under the File to link to the drop-down. Finally, add {“slug”:”scorecard”} (or whatever your slug from the Scorecard settings is) to the Extra URL parameters field (this is necessary only for scorecards at the moment) and click Save!
Once you go back to the front end of your site, you should be able to find the menu link you created, click it and see the newly created scorecard! Pretty dandy, right? This type of interface is incredibly useful and dynamic. Scorecards are already widely used by businesses in every industry; now they can have that same functionality produced beautifully in Tableau and displayed handily in their portal!