Before we can attempt a Marimekko, we need to understand a few of Tableau’s lesser used tools.
The first of these is the Polygon mark type which can be selected from the dropdown on the marks card. Since the Marimekko is actually made up of lots of x-y (Cartesian) coordinates we need to join the dots and colour in the middle, this is what the polygon tool does.
Usually when using polygons you have all the data that is necessary e.g. lat/long points on a map which define a boundary. In our case we want to use a single measure value and represent it as a polygon. This will involve replicating the line 4 times (once for each corner). To do this we must use the UNION ALL command in Custom SQL to generate the extra rows of data, we will also be adding a new column called ‘Point’ which we will use to define the corners of the polygons
Tableau Custom SQL (found in the edit connection window):
SELECT [Orders$].[City] AS [City],
[Orders$].[Customer Segment] AS [Customer Segment],
[Orders$].[Product Category] AS [Product Category],
[Orders$].[Product Container] AS [Product Container],
[Orders$].[Sales] AS [Sales],
[Orders$].[Unit Price] AS [Unit Price],
1 AS [Point]
FROM [Orders$]
UNION ALL
SELECT [Orders$].[City] AS [City],
[Orders$].[Customer Segment] AS [Customer Segment],
[Orders$].[Product Category] AS [Product Category],
[Orders$].[Product Container] AS [Product Container],
[Orders$].[Sales] AS [Sales],
[Orders$].[Unit Price] AS [Unit Price],
2 AS [Point]
FROM [Orders$]
UNION ALL
SELECT [Orders$].[City] AS [City],
[Orders$].[Customer Segment] AS [Customer Segment],
[Orders$].[Product Category] AS [Product Category],
[Orders$].[Product Container] AS [Product Container],
[Orders$].[Sales] AS [Sales],
[Orders$].[Unit Price] AS [Unit Price],
3 AS [Point]
FROM [Orders$]
UNION ALL
SELECT [Orders$].[City] AS [City],
[Orders$].[Customer Segment] AS [Customer Segment],
[Orders$].[Product Category] AS [Product Category],
[Orders$].[Product Container] AS [Product Container],
[Orders$].[Sales] AS [Sales],
[Orders$].[Unit Price] AS [Unit Price],
4 AS [Point]
FROM [Orders$]
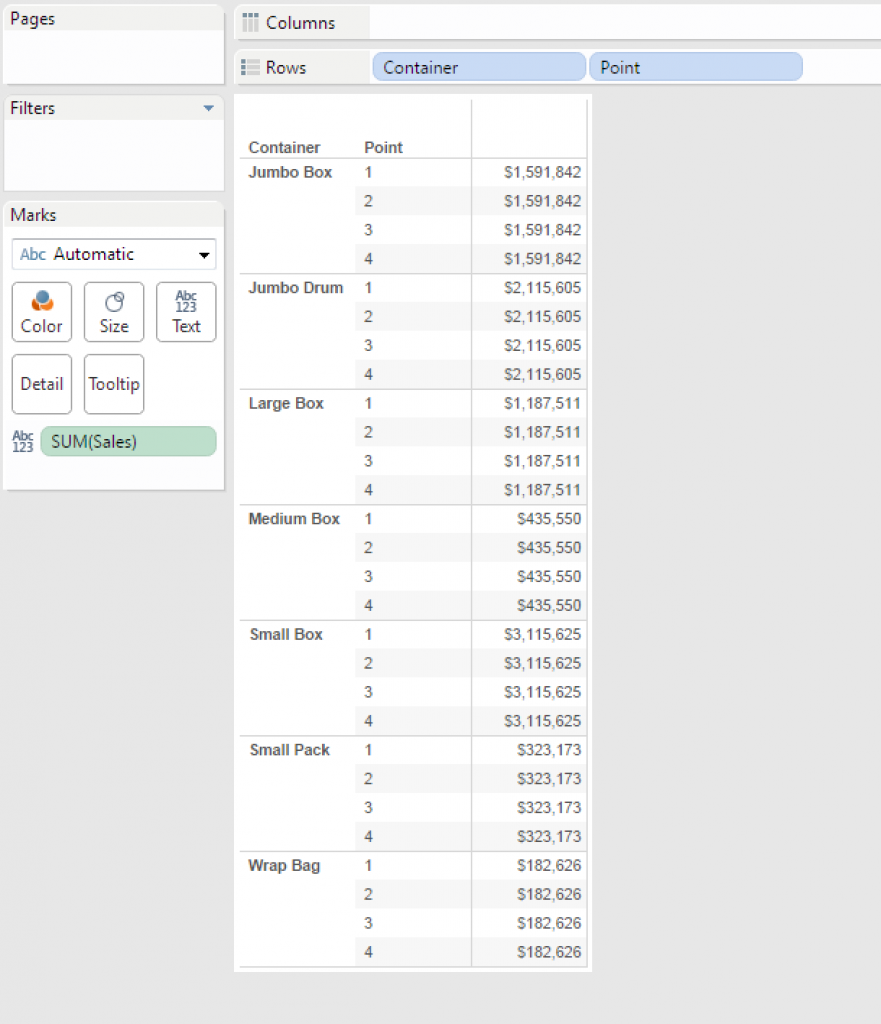
Once we have our data we will need to make sure that it as we expect. We should have 4 lines of data now for each line in our original dataset. Each of these replicated lines should have a unique point:
 In ‘Marimekko Part 2‘ we will look at Parameters and Table Calculations.

