3D pie charts in Tableau

Data

3D pie charts in Tableau

by Andy Cotgreave
//

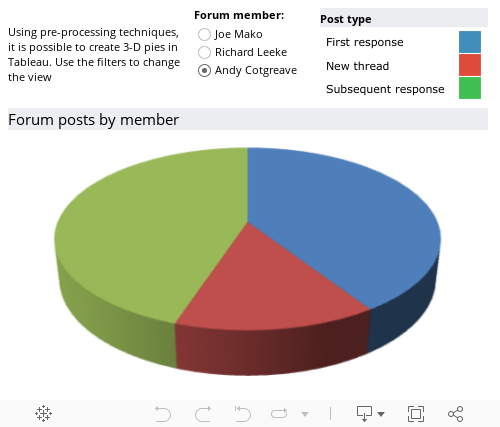
Earlier today, I posted on the Tableau Forum, suggesting it would be great if Tableau did 3D pie charts. Well, I didn’t think it would be possible, but using some data pre-processing techniques, and hacking the preferences.tps, I’ve worked out a way of doing 3d pie charts in Tableau:

I knew those developers in Seattle would implement this fantastic visualisation technique eventually. Well done Tableau for letting the community take advantage of good quality graphics. I’ll explain how to do it in a subsequent post.

Don’t forget to follow me on twitter to keep up with all the new techniques I discover!

More About the Author

Andy Cotgreave

Croydon Cyclone 2011 This weekend saw the Croydon Cyclone disc golf tournament. It was the biggest UK tour event for a long time, and the Croydon club ...
Panel Charts in Tableau Over on the forum, Jeremy asked about making trellis charts. For more info on trellis/panel charts, John Peltier has a great article ...

See more from this author →

InterWorks uses cookies to allow us to better understand how the site is used. By continuing to use this site, you consent to this policy. Review Policy OK

×

Interworks GmbH
Ratinger Straße 9
40213 Düsseldorf
Germany
Geschäftsführer: Mel Stephenson

Kontaktaufnahme: markus@interworks.eu
Telefon: +49 (0)211 5408 5301

Amtsgericht Düsseldorf HRB 79752
UstldNr: DE 313 353 072

×

Love our blog? You should see our emails. Sign up for our newsletter!