Why do you need to monitor the performance of your environment?
Your Tableau Server is a key element within your Tableau world, and for many people this is all they see of Tableau. They don’t get to play with Tableau Desktop, but they are the consumers of reports either through a web browser or mobile device.
Therefore, if there are any performance slow-downs with reports that they are accessing, then they are the first to notice as it’s their reports which they rely on which aren’t available at 09:00 for that important start-of-day meeting. It’s your role as the Tableau Server Admin to ensure (as best you can) that your environment is available and servicing their needs.
Within larger organisations there may be the infrastructure and the Server Engineers who can do this for you. However, even in these organisations it may be difficult to get hold of this performance data (in any meaningful form) so you may wish to set up your own monitoring so that you are in charge of it.
There are 2 main reasons for setting up performance monitoring.
1. Current Performance Profile. Gaining an understanding of how your system is running right now
- When are the performance peaks?
- Are there times when your server slows down?
- Why are they there?
- Is it a background process, or a slow running dashboard?
2. Capacity Planning. How have things changed since the server was installed / upgraded, or over the last 6 months.
- Can you infer what your environment will be like in 6 months’ time?
- Do you need to expand out your environment?
Take these 2 Examples. Which conversation would you rather have?
Scenario 1: Your Boss: What’s the problem with the Tableau Server? The CEO just called me to say that he can’t get his report today (again). You: Not sure Boss. Will take a look at the server?
Later on You: Hey Boss, you’ll never believe it but it looks like the server is max-ed out. CPU and Memory are both near 100%. Looks like we are either going to have to either limit access to the server, or spend some money on increasing resources. Your Boss: How did that happen? I don’t have any additional budget right now. You: Um, not sure really…..
Scenario 2: You: Hey Boss, I have just got the latest data from the Tableau Server Performance Report. It looks like over the last 3 months, the concurrent user-count has increased by 20%, which has increased average CPU usage to 40% during normal operating hours. We should be OK for the next 6 months or so, but I think that we should start planning to spend some of that budget that we’ve set aside on increasing the server performance. Your Boss: Well done. Sounds like a good plan…
3 Steps to Performance Monitoring Your Tableau Server
- Set up Performance Monitoring on your Servers
- Transform your Data into something Tableau can read.
- View and Analyse your Performance Data in Tableau.
Step 1: How to set up performance monitoring on your environment
By Default Windows Performance Monitor (perfmon.exe) is installed on all Windows Desktops and Servers.
1. Create a Folder for the performance logs (ie. D:Perflogs).
I would avoid writing performance logs to the C: drive, if possible. The last thing that you want to do is use up all the disk space on C:, stopping your server from working normally, because you have filled it with log files.
2. Copy the TableauServerPerfLogs.xml file to this folder. This file is a template file with the counters, and settings needed to monitor your environment. The following counters are in the file, but you can add more or remove ones if you require.
- LogicalDisk(*)*
- Memory*
- Network Adapter(*)*
- Network Interface(*)*
- PhysicalDisk(*)*
- Process(*)*
- Processor(*)*
- System*
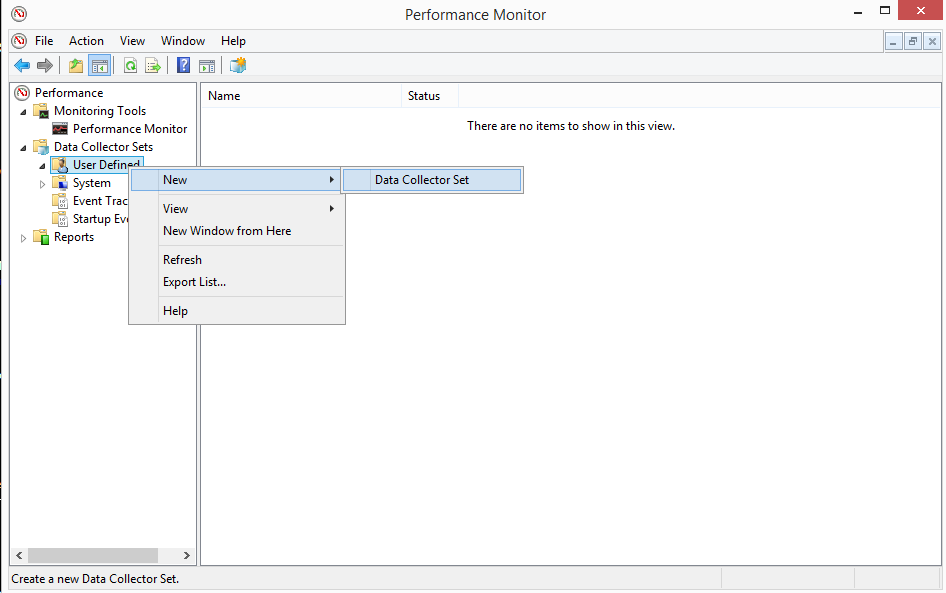
3. In Performance Monitor, Select Data Collector Sets, User Defined, and Right Click to create a New Data Collector Set.
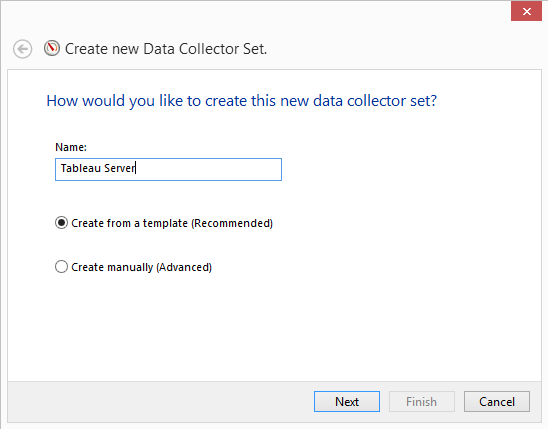
4. Name the Collector Set to “Tableau Server”, and Select “Create from a Template”. Click on Next
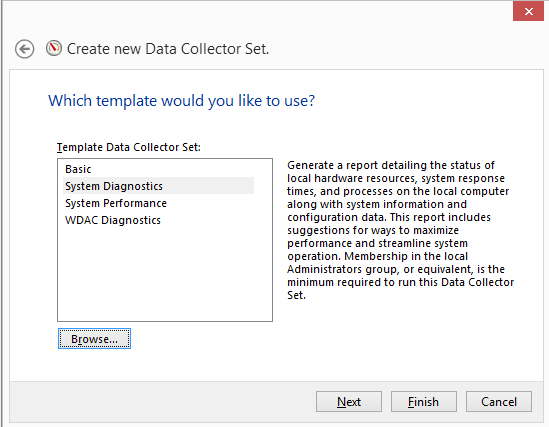
5. Click on Browse, change the folder to the correct location and select the Template file “Tableau Server Perflog.xml”
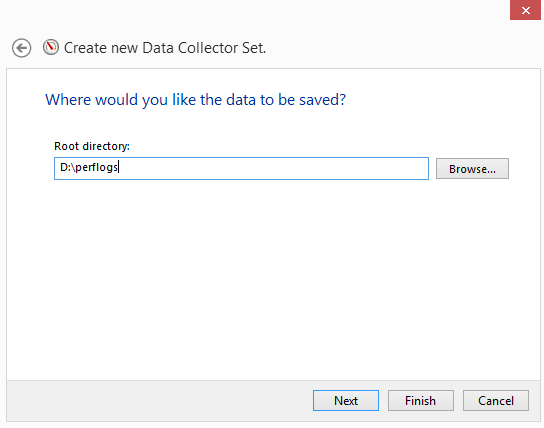
6. Select the Folder where the Performance Data will be saved to. Recommend D:Perflogs. Click on Next.
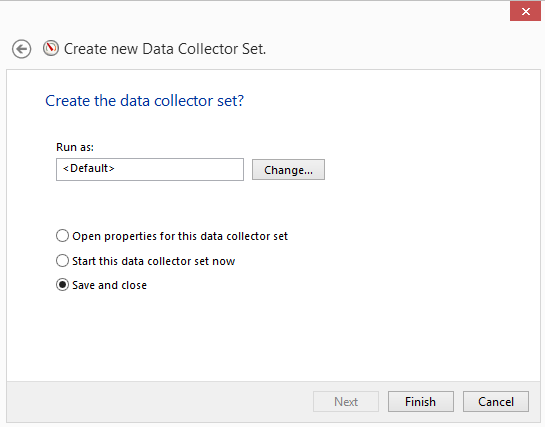
7. Choose the user that the collection will run as. Normally the Default will do. Click on Finish
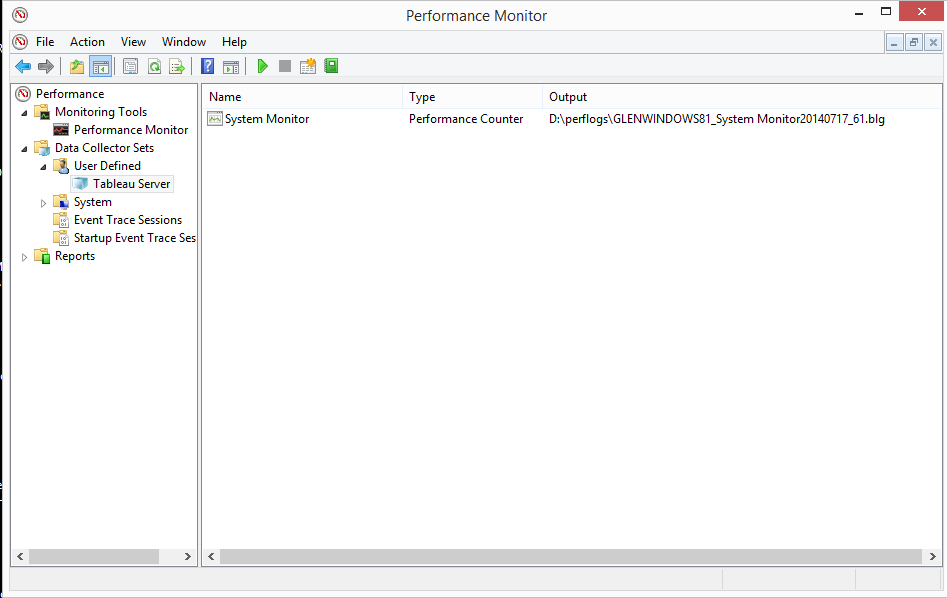
8. Performance Monitoring has now been set-up. Settings and Options can be reviewed by right clicking on the Tableau Server Collection Set and on the System Monitor Counters.
Next, you need to decide when monitoring will start and stop.
These are some of the options
Starting and stopping the perfmon job is done manually. This isn’t necessarily ideal, as you may forget.
Set a stop condition
This can be either on disk free space, on a duration (ie after 1 day), or you could even set it to write a circular binary log file (which will never grow above a certain size)
Set a start condition
Schedule a start time, using Task Scheduler.
Set Task Scheduler to start the Performance Monitoring at server start up.
(To do this, run the following command at a command prompt as an administrator on the server.)
SCHTASKS /Create /TN TableauServerPerfmon /TR “Logman Start ‘Tableau Server'” /sc onstart /RU System
9. Once all has been set up and configured, test and monitor the logging to ensure that monitoring is working as expected.
N.B. If you are running Tableau Server in a High Availability Configuration with worker nodes, then you will also need to perform the same steps on the worker servers too.
The Performance Monitoring Template has been configured with the following parameters
- Logs are written to a Binary Log file
- Interval is every 30 seconds
- File Name: %ServerName%_TableauServer_yyyyMMdd_N.blg
- The log file will close after 1 week of activity being written to it, and a new log file will then open.
The main reason for choosing to use Binary Log Files, is that when writing to a text log file (either CSV or TSV), if a process starts after the performance monitoring has started, then that process won’t be monitored.
Also, within perfmon there is the option to write to a MS SQL Database. If you have this available to you then feel free to do so…
Performance Monitoring Strategies
Ad hoc: Running Performance Monitor when you are experiencing an issue, or if you want to see the performance of your server.
Interval: Running Performance Monitor on a regular basis, ie. Every 3 month, run for 1 week. This gives you the ability to see how the performance [profile of your server has changed over time.
Continuous: Running Performance Monitor all the time. Archiving the log files for future reference.
Step 2: Transforming Your Performance Data
The second step is to transform your Performance Data into something that can be viewed in Tableau.
Convert your data into a CSV File
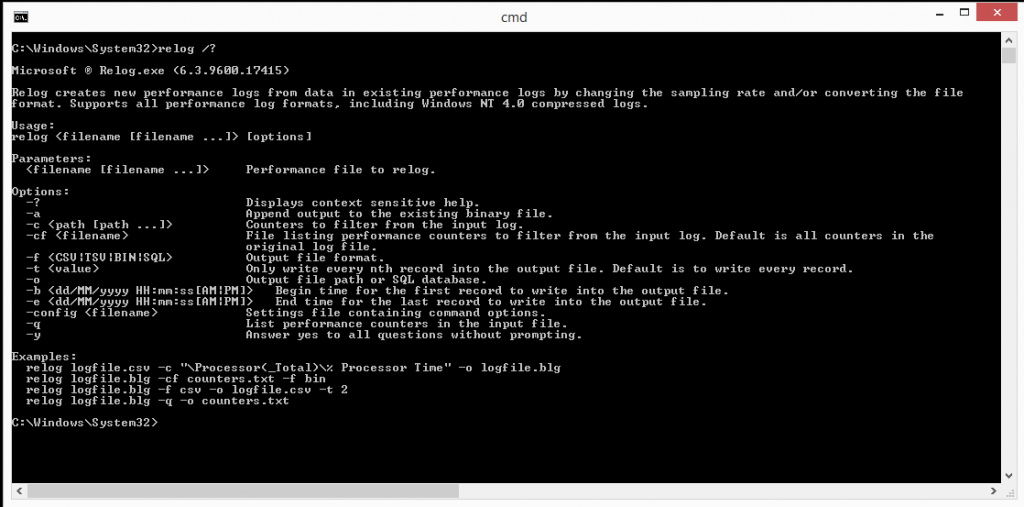
The data that you have collected on your Tableau Server(s) are in .blg format. Microsoft handily give us the relog.exe command to convert these Performance Logs into different formats.
In addition, there are a number of options so that you can merge individual log files together (from the same server, or from different servers), set the date range, select individual counters, etc etc.
The basic syntax for the command is
relog logfile.blg -f CSV -o newfile.csv
This is taking your Perfmon Logfile (logfile.blg) and converting it into a CSV file called newfile.csv
If you wanted to convert a number of files into the same CSV file (i.e. all the Logfiles from the individual servers in your cluster), then you can do this by
relog *.blg –f CSV –o newfile.csv
Transforming the CSV File
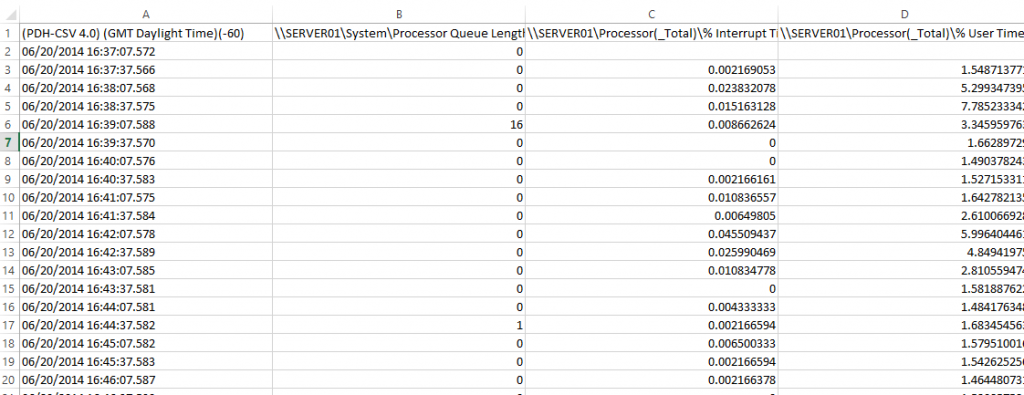
The CSV file that you have just created has a column for the date & time information, and then individual columns for each counter that you have selected to be monitored.
This is OK, but it’s not the easiest format to work with in Tableau.
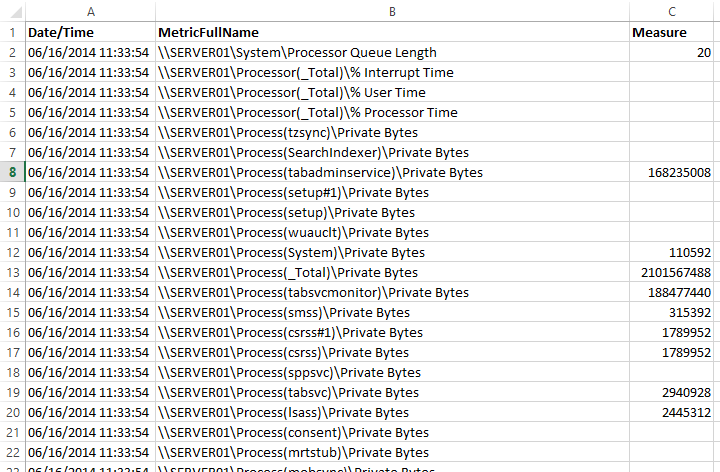
It would be better if the data was pivoted so that there was one column for date & time, another for the metric name, and a final column for the value of that metric, so that it looks like this.
There are a few ways that we can transpose this data
- Option 1: In Tableau 9 you can do the transpose as part of the connection to the data
- Option 2: Use the Tableau Excel Add in.
- Option 3: I have created and shared a Alteryx Workflow that will complete this. (see download file)
- Option 4: I have also written and shared a VBScript which will do this (See download file)
Options 1 & 2 get a bit tricky if you have a large number of metrics being measured, or you have been measuring performance for a long period of time.
Option 3: If you have Alteryx Designer, you can download and use the Workflow to complete the transformation of the data in the CSV file. The output file of the workflow is a Tableau Data Extract (TDE) file which makes life easier once you open it in Tableau Desktop.
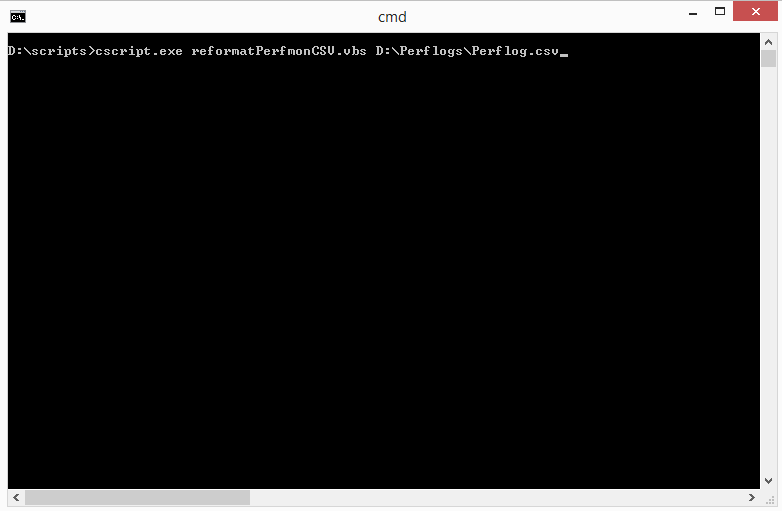
Option 4: Download and run the VBScript file to transform the CSV file ready for use in Tableau Desktop. To run the script, use the following command in CMD prompt
cscript.exe reformatPerfmonCSV.vbs %filename.csv%
The output from this script is %filename%_tableau.csv. (Warning, by transposing the data in this file, the new file is about 10x the size of the old file.)
Next you need to convert the data in a TDE file using Tableau Desktop
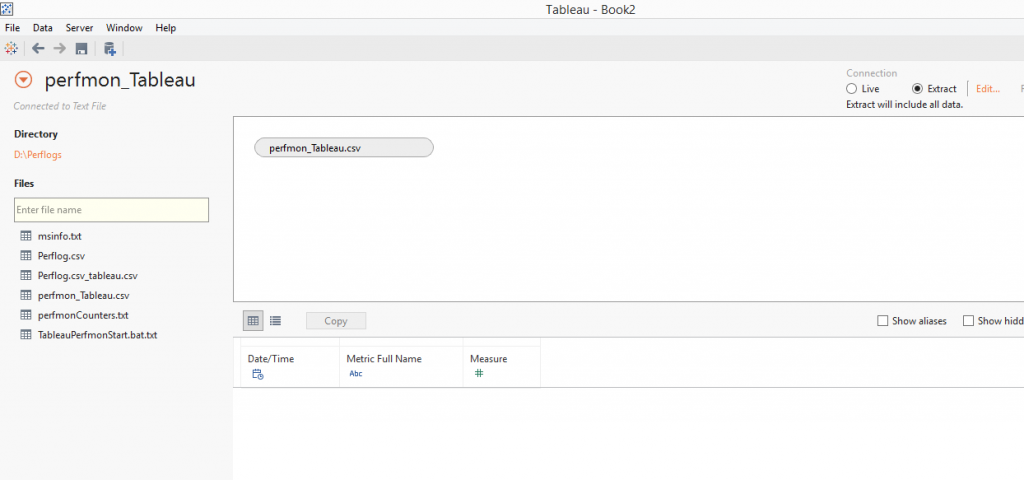
1. Open Tableau Desktop and connect to the CSV File you’ve just created.
2. Select Extract as your connection type, and save the extract.
3. Open the Tableau Perform Example Workbook (see download file), and change the data source to use extract you have created (either using the Alteryx Workflow or the method above.)
4. Start Analysing your data
Step 3: View and Analyse your data in Tableau Desktop
Below is a Tableau Viz I have created for a Tableau 8.x Server. At a glance you can see the main metrics of the server.
- CPU Usage
- Memory Usage
- Disk Capacity
- Disk I/O Performance
You can filter the date & time range to focus in on a particular point in time. The other Tabs in the workbook give you a view of the Individual Tableau Server processes, for deeper analysis. Also, If you had multiple servers (like in a cluster) you would be able to either compare the performance profiles of all the servers, or set-up a Quick Filter so that you could focus on an individual server. Link to Download Files Area Download Files I hope that you have found this article useful. Please let me know what you think, if you have any suggestions or if you have any questions. For my next article, I will be writing about accessing & viewing the historical utilisation data stored in Tableau’s Postgres Database, so that you can compare the Windows Server performance against the Tableau Server statistics (i.e. Number of user connections, Data Extract refreshes, etc, etc). For more on this topic take a look at this webinar of the work that Dave Hart did at UBS here
https://youtu.be/CFc6khaRSAw?t=14m7s Good luck, and happy monitoring your Tableau Server. EDIT: We received a very interesting and thought provoking tweet from Tamas Foldi asking “why this method is better than getting the stats from jmx where cpu, mem metrics are on service & thread level?”
For those that are unaware, you are able to monitor different aspects of Tableau process usage by enabling the jmx ports on your Tableau Server. (Help Article from Tableau: http://onlinehelp.tableau.com/current/server/en-us/ports_jmx.htm) From my experience, I think that these are two different problems that are being solved here. Using Windows Performance Monitoring and analysing the output of this is about looking at the overall health and performance of your server. You are seeing what Tableau is doing, but you are also seeing what is going on with your Windows Server. Opening the JMX ports and analysing these results is more about investigating and troubleshooting a particular issue with Tableau, or really delving deeper into the workings of Tableau itself. Having said that, you could use JMX to monitor other aspects of your Server, not just Tableau, but then you are into different discussions about Corporate Infrastructure Monitoring Strategies and which tool is best for monitoring Windows Servers, etc. This wasn’t really the point of my article. My article was about giving a Tableau Server Admin a quick and easy way of collecting and displaying what is happening under the bonnet of their Tableau Server. Thanks Tamas for you comments and this gives me a great idea for a future article.

