
Here in InterWorks we are getting a little bit over-excited about Tableau 9.
Especially, when this blog post came out from the Tableau mothership.
Individual Query time improved by 10x
Dashboard Query times improved by 9x
Query Fusion improving times by 2x
And Query Caching improving times by 50x
Those are some pretty bold figures to put out there..
Not being one to believe everything that I’m told, I thought that maybe it would be great for someone to do their own independent testing to check on those numbers.
So…… I waited, and as no one did, it was left to me to do my own testing. So here we go….
Testing
Step 1: Build out 2 identical servers in Amazon Web Services EC2 (http://aws.amazon.com/ec2/) I went for an m3.2xlarge server which has 8 vCPU (Intel Xeon E5-2670 v2) and 30 GB of RAM. (A pretty standard server setup.)
Step 2: Install Tableau 8.3 64bit Server on the first server, and Tableau 9 Beta 4 64-bit Server on the other.
Step 3: Upload my 150 million row Data extract to both servers. Step 4: Create a dashboard to query the Data Source. (if you click on the image it will expand)
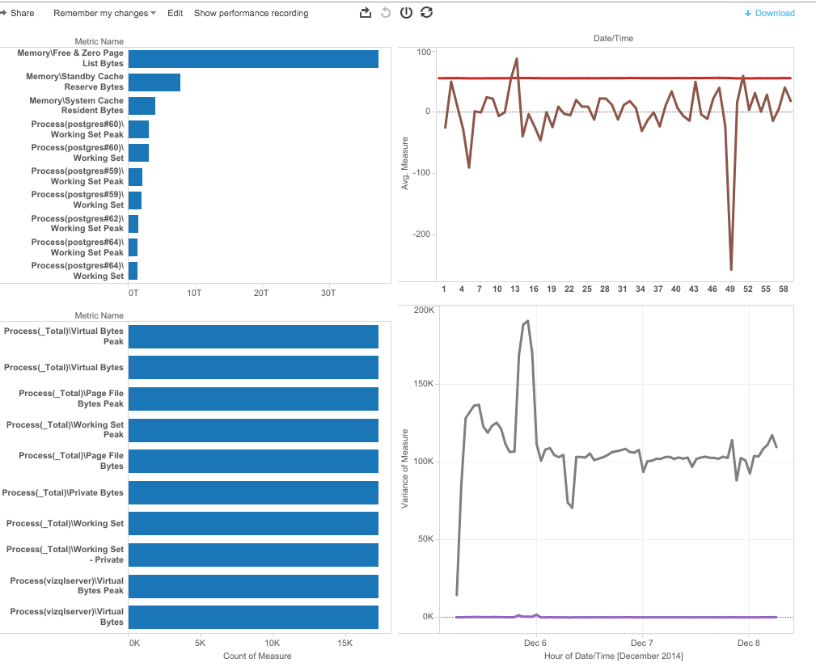
Tableau Server Performance Testing Dashboard[/caption] Step 5: Test dashboard, record the timings and compare.
Results
First let’s look at the Tableau 8.3 performance recording.
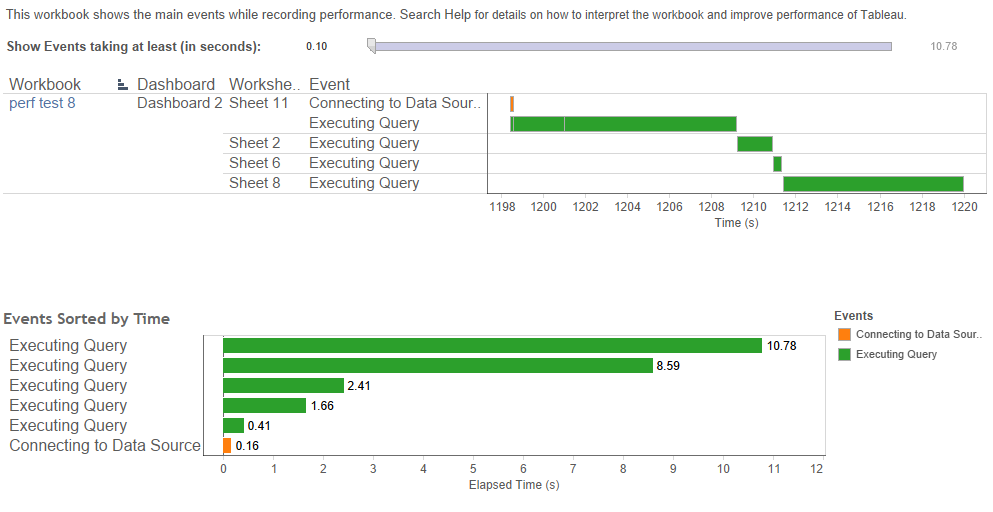
Tableau 8.3 8vCPU Performance Recording
So what we have here is a pretty standard Tableau 8 dashboard performance recording, with each query happening sequentially, one after the other. The duration of the longest query came in at 10.78 seconds, with the overall duration from start to finish of around 22 seconds.
Now, let’s take a look at the same query on Tableau 9 Server
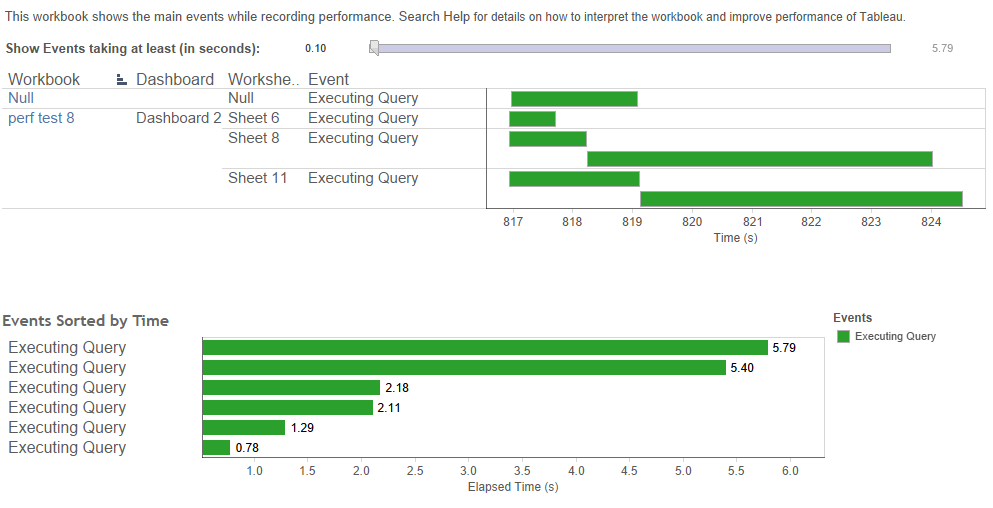
Tableau 9 8vCPU Performance Recording
Whoa!!! So what’s happening here then?
To start with, we have much shorter query durations, with the longest query length down from 10.78 to 5.4 seconds, and we also have parallel query executions to bring the overall time down from 22 seconds to 7.5 seconds
That’s not bad at all…
Now, let’s take a look at the underlying server performance, to see what’s happening
First the Tableau 8.3 server
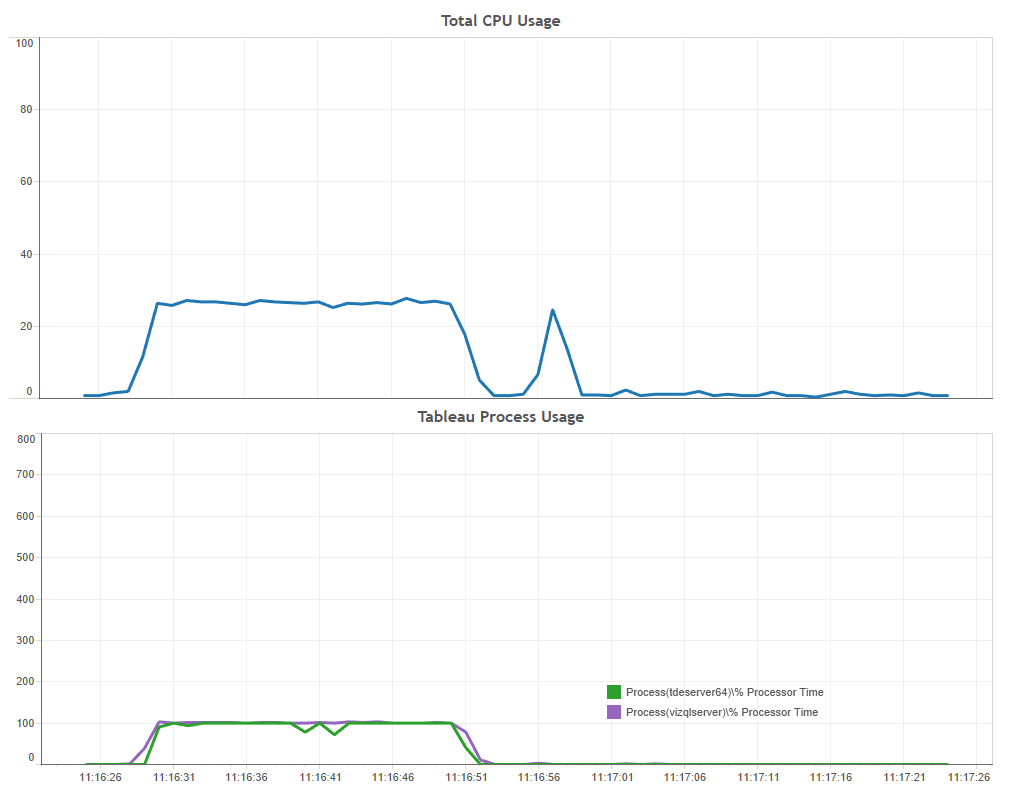
Tableau 8.3 8vCPU CPU Performance
There are 2 points to notice here.
Firstly, the total processor usage never gets above 27% [blue] of what the server is capable of for the duration of the query.
Secondly, both the VizQL (vizqlserver [purple]) and Data Engine (tdeserver64 [green]) processes max out at one vCPU each.
Now let’s take a look at the Tableau 9 server..
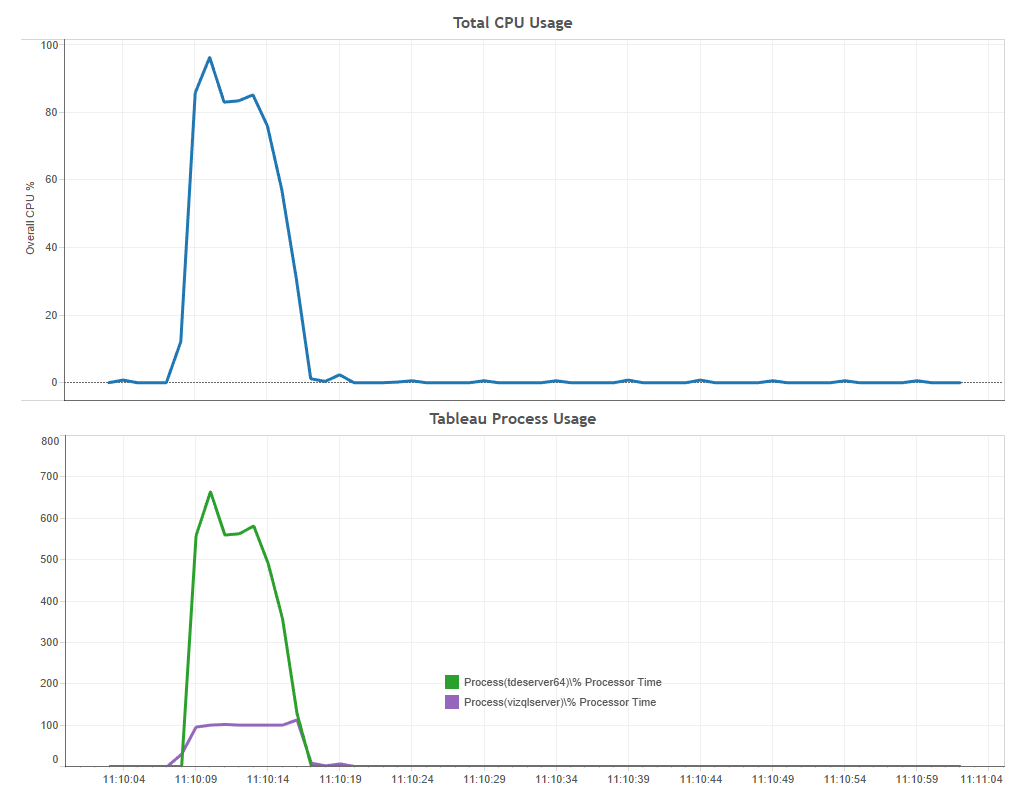
Tableau 9 8vCPU CPU performance
We see that again the VizQL process continues to use 1 vCPU, but now the Data Engine is multi-core, with the result that the total processor usage peaked at around 96%, and a much much shorter overall query time.
Now, I know what you’re thinking; what effect does increasing the number of cores in a server have on the overall query times?
As you’ve asked so nicely, let’s find out…
I changed the underlying image on AWS from a m3.2xlarge to a c4.4xlarge for both the Tableau 8.3 and Tableau 9 Servers.
A c4.4xlarge server has 16 vCPU (Intel Xeon E5-2666 v3) with 30GB of RAM (effectively doubling the core count for this test)
The same query run on Tableau 8.3 Server.
|
Tableau 8.3 16vCPU Performance Recording |
Tableau 8.3 16vCPU Processor Performance |
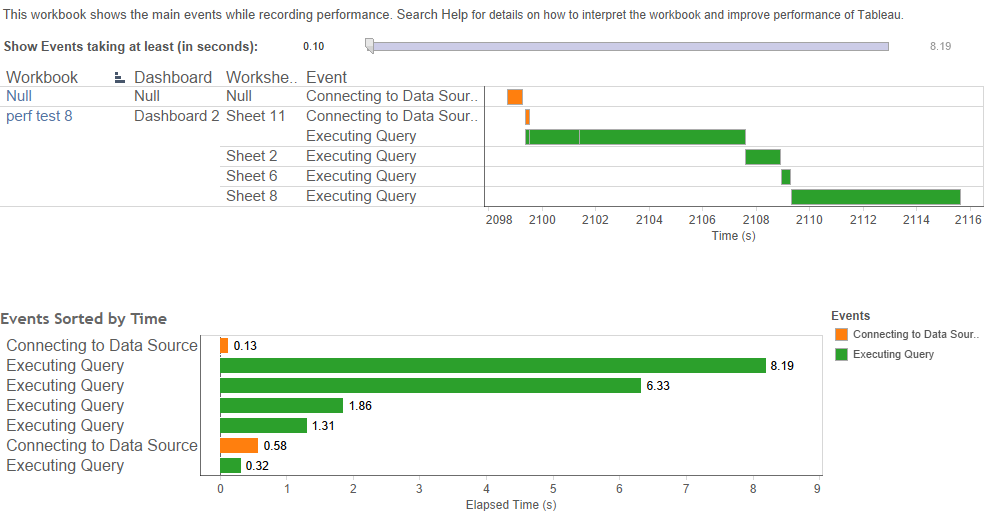
We do see a shorter overall query time (down from 22 seconds to around 16 seconds).
But, we see the same process & processor usage profile as Tableau 8.3 running on 8 vCPU, with only one core being used for each of the VizQL and Data Engine processes.
(Note that the improved query times moving from 8 to 16 vCPU may well be due to the changes in the underlying hardware, including the use of a faster Processor.
Now, on to Tableau 9 running on 16 vCPU
|
Tableau 9 16vCPU Performance Recording |
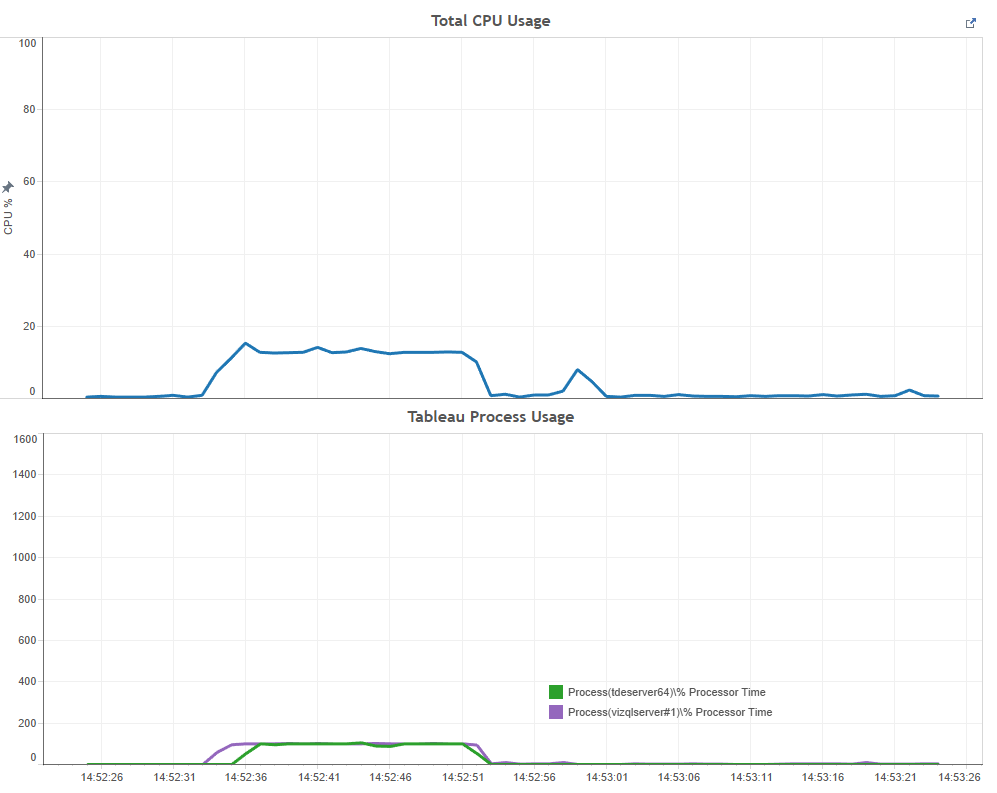
Tableau 9 16vCPU Processor Performance |
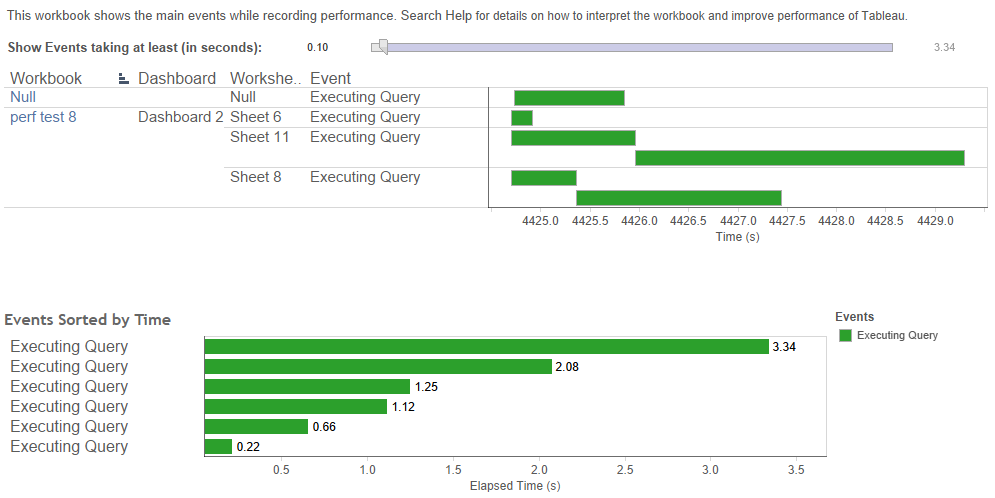
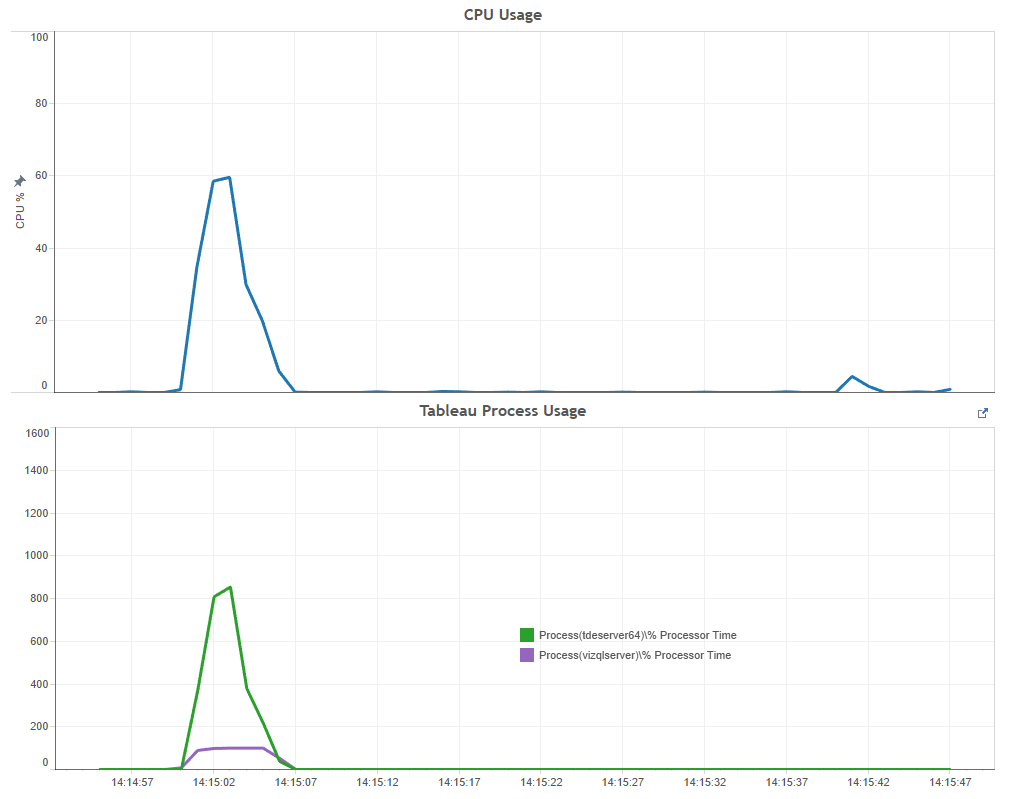
Again, we see the parallel querying and also, and an improvement in query times, with the longest query now taking 3.34 seconds, and the overall query time down to a sparkling 4.5 seconds.
This is reflected in the performance chart, where again we see the multi-core in action. (This time peaking at just under 60% utilisation)
Summary and Conclusions
| Server Type and Tableau Version | Time Taken for Longest Query (secs) | Overall Dashboard Duration (secs) |
| Tableau 8.3 (8vCPU) | 10.78 secs | 22 secs |
| Tableau 8.3 (16vCPU) | 8.19 secs | 16 secs |
| Tableau 9 Beta 4 (8vCPU) | 5.4 secs | 7.5 secs |
| Tableau 9 Beta 4 (16vCPU) | 3.34 secs | 4.5 secs |
So what to make of all those figures…
- In my test, moving from 8 vCPU to 16 vCPU give me a speed increase of around 30% for Tableau 8.3 and around 60% for Tableau 9. As I said earlier, this may well be due to the underlying hardware being better on the c4.4xlarge than on the m3.2xlarge, and nothing to do with Tableau itself. (Investigating this thoroughly is beyond the remit of this piece.)
- However, upgrading from Tableau 8.3 to 9.0 on 8 vCPU server boosted performance by just under 3 times, and for the 16 vCPU server, by just over 3.5 times.
Those are some pretty thrilling figures. They’re not quite in the same league as the Tableau Blog figures, but still interesting enough..
I guess it’s going to depend on your own dashboards, your datasets and the overall load on your Servers, as to what performance improvements you will see. Also, in this testing I don’t take into account the other features offered in Tableau 9 such as Query Caching or Query Fusion (which I haven’t gone into here, and if no-one else writes about these features, I may have to do so myself)
So overall, you are going to see great improvements in the times taken to render dashboards. This is going to make your customers happier which is going to make you happier. However, what I’m not so sure about is what effect this upgrade is going to have on your servers. There are a few unknowns out there such as;
- Are you going to see more user load on your Tableau server, as they now are more readily gain access to their reports?
- Are you going to be publishing dashboards which you would never have done on Tableau 8 because their performance wasn’t acceptable, but is now (additional load)?
- Is having a more ‘peaky’ CPU performance profile going to cause you issues, which may necessitate additional Hardware purchases?
- Or will having Query Caching and Query Fusion save the day, and actually result in less load on the server?
All these are questions and more are what makes this server upgrade extremely exciting and takes Tableau 9.0 to a #WholeNewLevel. If you’re yet to download Tableau Server, or would like more information on it, please click here or feel free to shoot me a message.