Do you ever have those watercooler debates at work that never get a real sense of finality? A coworker claims the trade OKC made for Carmelo Anthony was worth it, and you know in your heart that they are completely wrong, but you keep it civil. That’s the type of scenario that faced my section of cubes in the InterWorks Stillwater office on November 5.
Respected InterWorks young gun, Holt Calder, claimed during a conversation on Thin Mints that all the thin-mint cookies on the market are made in the same factory. I have had my fair share of Thin Mints—one year I ordered an entire case of the goods just for myself—so Holt’s claim was blasphemous in my mind. All that being said, I was willing to let it go.
However, the next day, Tracy strolled in with thin-mint cookies from Walmart’s Great Value brand, Aldi’s Benton’s brand and Keebler’s Grasshoppers. We had some Thin Mints hidden away in a cabinet of the office, so all the main players were there. Chelsie took the initiative to print some scorecards, separate out the cookies with anonymous labels and place half of them in the freezer. Word spread through Slack that there was going to be a blind taste test in the kitchen at 11:30.
Establishing Blind Test Guidelines
- No one would know the brand of the cookie.
- Everyone would close their eyes while eating so as to not be influenced by other people’s reactions.
- Pinky promise.
With those precautions taken, we knew that our data and results would be valid in the eyes of the scientific community. Some of us ate just four of the cookie options; some had all eight. Now, I am a tough cookie (pun intended), but that was a lot of Thin Mints to eat.
Data Entry in Tableau
At the end, I collected the scorecards and was fed a few more facts like the price of the cookies and how many were in each box. Back at home, I began a bleeding-edge data-entry process: manually plugging the numbers into an Excel file while enjoying a can of Iron Monk’s Stilly Wheat. This could have been made easier with Tableau’s extension to reshape data in Microsoft Excel, a simple and super-handy tool for anyone typically dealing with Excel data connections in Tableau. The built-in Data Interpreter of Tableau Desktop has supplanted some of the functionality within Tableau itself, but if you are still unsure about how your data should be formatted before bringing it into the program, the Excel extension is a great way to see this reshaping happen.

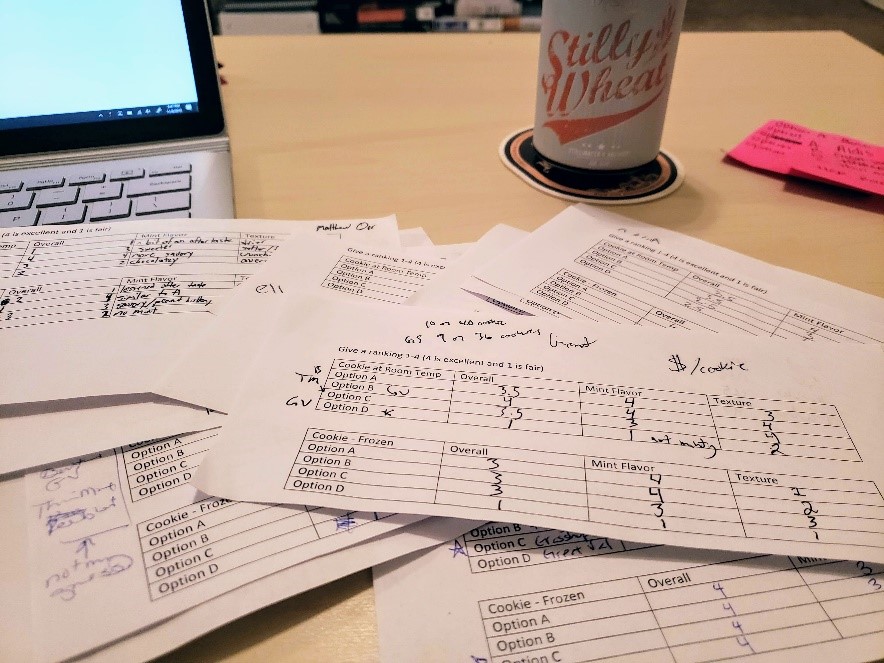
Above: The blind taste test slips during the data entry process.
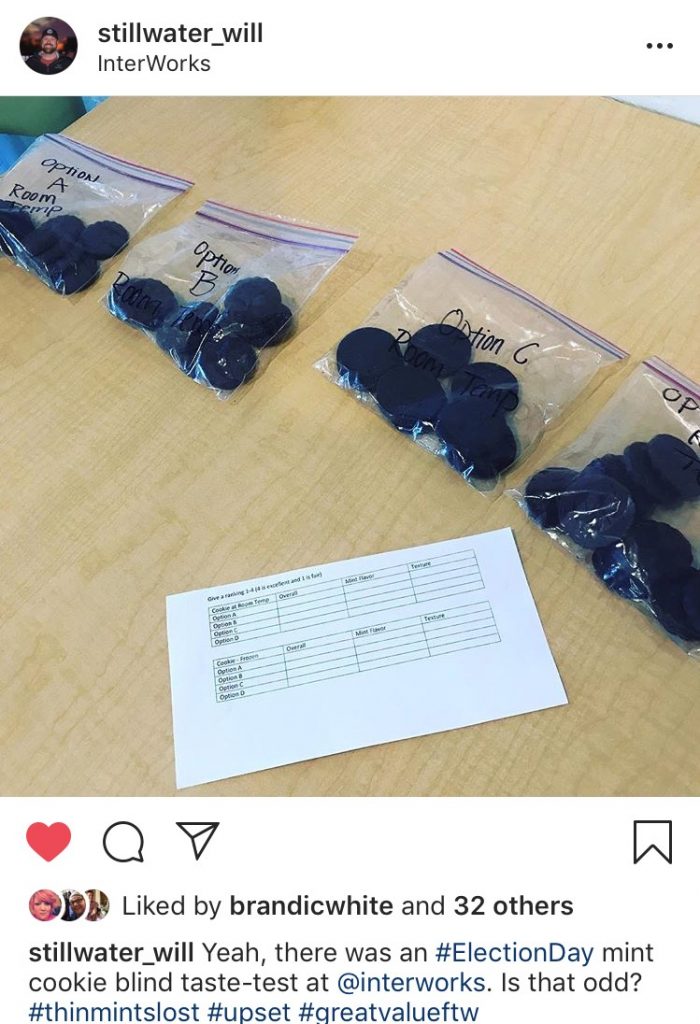
You can get a sense of the data from the slips shown above. I gave feedback on Keebler’s lack of mintyness; others had plenty more observations. I took the comments that people did leave and used them in the eventual dashboard … when they were legible (*cough* Mayor Will Joyce). Side note: the Facebook Mayor even turned to Instagram to share the action with citizens of Stillwater:

The Culture Behind the Cookies
This is a story about a fun dashboard, but it is also a story about the great company culture we have here at InterWorks that I get to be a part of all the time. No one told Tracy to bring in these cookies. No directive was sent down from HR that we should organize an event for “team building.” No one told me to make this blog. This was au naturel. It worked because people liked the idea and bought into what we were building. The same goes for the tools and companies we work with. We work with the tools we do because people believe in them, and we do the work we do because people are invested in it.
Check out the insights we gained below, and see for yourself if Holt’s claim that all the cookies are made in the same factory seems plausible!

