
You’re a young adult in Tulsa in 2007 and you’ve got a date at a hip, new froyo place. You think to yourself (because you won’t listen to Mom), “Oh, that construction on 71st is so lame. I’m going to avoid it by speeding down 81st to Garnett and cutting through the Walgreens parking lot so I don’t get stuck at that long red light and end up being late.”
You’ve got this. You run this town. You speed down Garnett and cut through the parking lot, just like you planned, but you get too cocky and pulled out right in front of the lifted pickup truck that actually had a green light heading east. And now you’re here. In my dataset of Tulsa Police Department collision reports, visualized with Tableau Software.
The Data
The City of Tulsa started the “Open Tulsa” initiative in 2013 to provide data for citizens and show more transparency as a government. In tandem with this is the concept of Urban Data Pioneers, who are community members who want to aid the local government in identifying problems and analyzing the data to aid in the policy process. So, it was in this spirit that I developed this Tableau visualization.
A Quick Method Tip
Now that we have this dataset, what should we look at? Maybe we are interested in weekly traffic trends: When do people go from the ‘burbs to their work. TPD has given us the time of the incident in the report! So, we can see in a simple highlight table that distributes collision times across days of the week and hours of the day, like so:
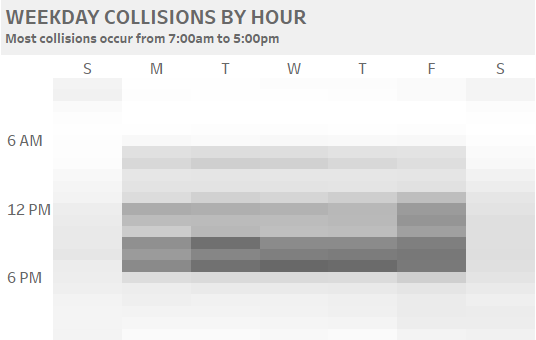
What does this tell us? We should stop going to work because it just leads to traffic collisions … just kidding, kind of. We do see that the majority of accidents take place during everyone’s rush to make it home to their beautiful Coors Light, I mean, wife.
The Dashboard
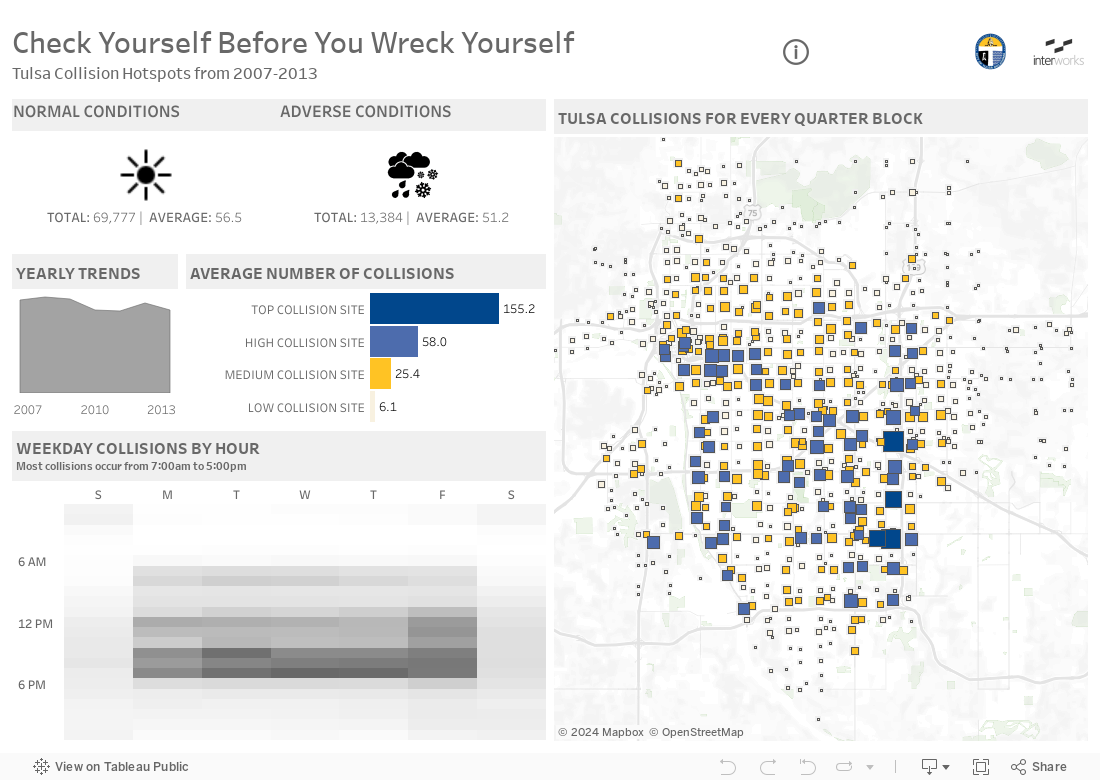
We can also use this highlight table to filter other visualizations on our dashboard as well. If we want to see how the geographical distribution of accidents changes during rush hour, we can select a block of our highlight table and see the data points on our map change in size and congregate a little more around the highways of the city. If we want to see how collision numbers from Friday and Saturday nights have changed over the timespan of our dataset, we can select a few boxes in the bottom-right corner of the highlight table and turn our eyes to the yearly trends tile; it looks like these late-night incidents have seen a drop in recent years!
Another point of interest is in the averages listed below our weather icons in the top-left corner. You may notice that the average normal day actually sees more collisions than a day with poor driving conditions. This seems really counterintuitive and threw me for a loop when I first saw it. Then I got thinking about my own experiences and the time I may or may not have hit some ice on a highway interchange and rubbed up against a barrier. The damage was cosmetic, so I just went on my way without the need to file a police report, the piece of paper that gets you into my dataset here. In fact, Tulsa Police Department derived a longstanding policy from the same logic called Operation Slick Streets, where they will only respond only to injury accidents on poor weather days. The thought behind this being that they will send their people where they are needed most on these days.
Let’s move on and check out our different “Collision Sites,” notated by the different colors. These were clustered together on the basis of size – relating to the number of collisions in a given area – using Tableau’s native clustering in the Analytics pane.
If we click on the dark blue for Top Collision Sites, we can see those four blocks highlighted on our map, their bar highlighted in the bar chart and the highlight table showing us a temporal distribution of collision activity. Did you notice the widening of the distribution on the highlight table when we made this selection? That’s because those locations are mainly shopping and leisure areas, meaning that people are more likely to go there outside of work hours compared to the average location in Tulsa. If we try the same method with Low Collision Sites, we see a similar pattern; these are likely residential areas.
Another point of interest is our ability to hone in on the main arteries of the city!
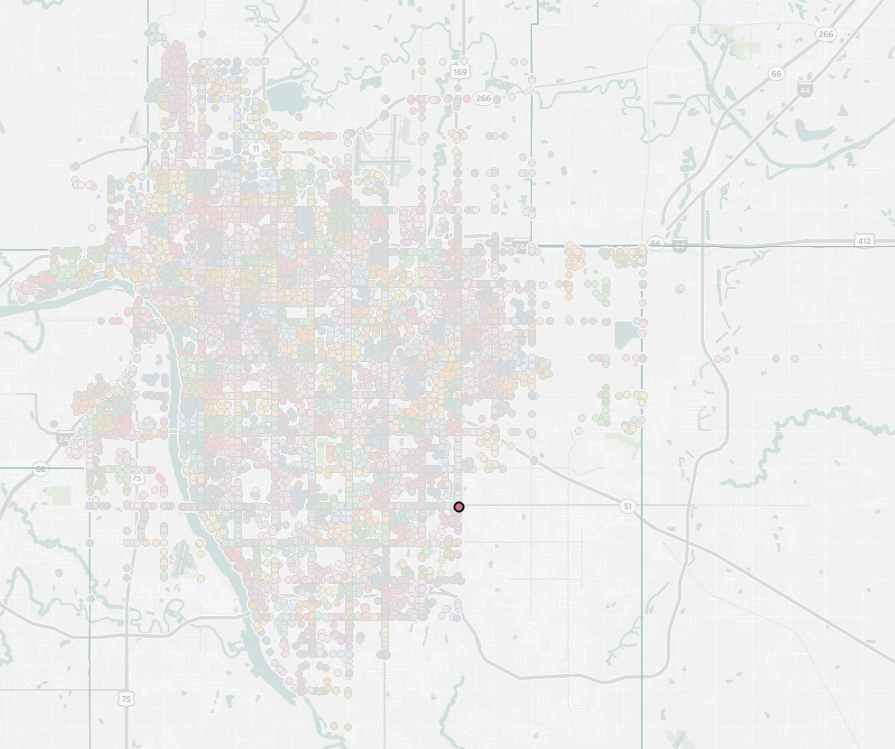
I remember reading an Artemis Fowl book back in my middle school glory days and the team of central characters were trying to hunt down a “perfectly” invisible aircraft. It was undetectable by any sort of radar, sonar, you name it. So, the genius protagonist’s solution was not to look for where it was, but where it was not. We can try to visualize the city’s main routes by selecting those locations with the most collisions, but a better way here is to select the lowest collision sites and see where these high-traffic and high-collision areas are not. What do you know? The main highways heading towards downtown appear to slice through the data points like a hot knife through a pad of butter.
Sometimes, where data is not is just as informative as where it is.