In the final installment of this series on time-based comparisons, we are diving into comparing a single day’s performance against the historical performance for that particular weekday.
To clarify the purpose of this post, suppose that the most recent day you have recorded is a Wednesday. How do you go about assessing if performance was good or bad? The method I outline here takes the approach of narrowing the lens of comparison to only consider other Wednesdays.
As an example of when this approach is useful, consider that you are tracking a product whose performance is expected to vary greatly from one day to the next, while maintaining a consistent weekly trend. This is common for products such as online multiplayer games, where people play more on the weekends than they do throughout the week. When analyzing such a product, it often doesn’t make sense to compare day-to-day performance because that compares apples to oranges. Similarly, if we continue with the video game analogy, it won’t be very useful to compare a single day to a weekly average because the average will be low compared to the weekend (period of high activity) and high compared to the weekdays (period of low activity). The overall average muddies the water.
So, what do we do?! My approach is to isolate the analysis to compare apples to apples. In this case, our apples are all the data points which occur on the same day of the week as the most recent date (the one we are analyzing). As a disclaimer, I wouldn’t recommend relying solely on this single metric. However, when accompanied by the time period comparisons outlined in the previous posts, this can help provide valuable perspective.
Step 1: Calculate the Maximum Date in Your Database
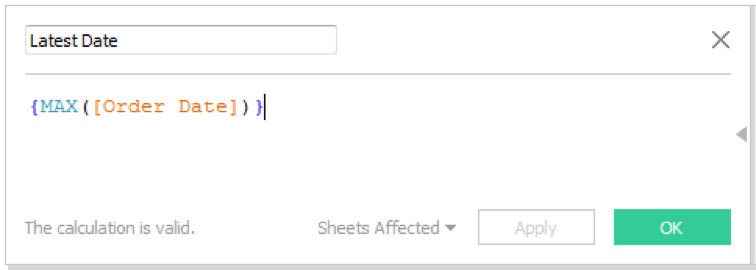
The curly brackets wrapped around the MAX() function in this formula force the output to return the maximum date in the database. Without the curly brackets, this formula would be applied at the row level (this would be a bit silly since each row has a single date value which is its “max date”) and would not function as intended in the formulas below.
Step 2: Calculate the Performance Metric for the Latest Date
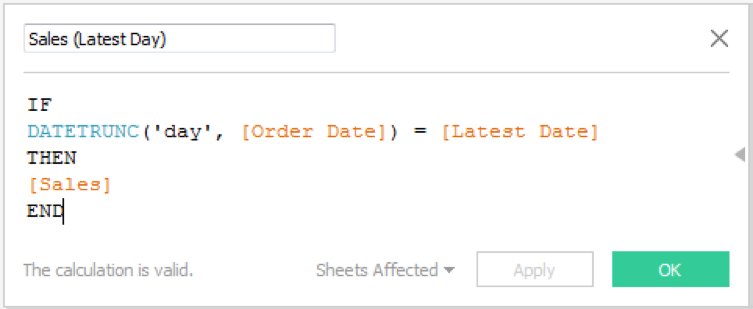
This formula only captures ‘Sales’ numbers for records occurring on the same day as the most recent date in the database.
Step 3: Calculate the Performance Metric for the Historic Time Period
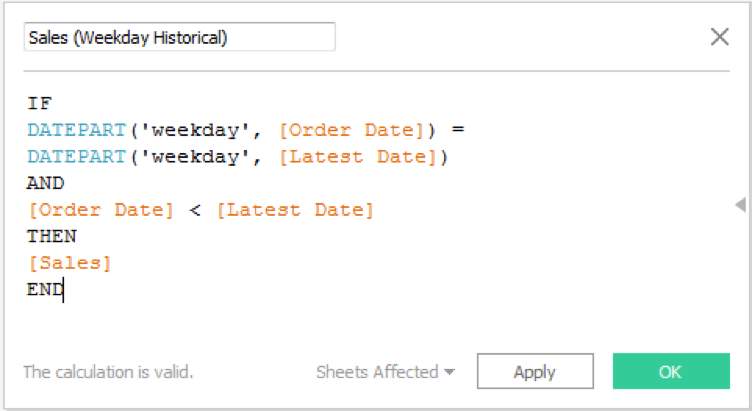
This formula only captures ‘Sales’ numbers for records that occur on the same weekday as the most recent date, with the exception of the most recent date itself. So, if our most recent date is a Wednesday then this formula seeks out only sales values for other Wednesdays in the database.
You can control this historical time period by adding additional logic into the formula. For example, if you only want to consider this metric within the context of your current year (a year-to-date historical value) then you could make this modification in the formula by including that logic as an additional AND statement within the IF/THEN expression.
Step 4: Compare the Most Recent Date to the Historical Value
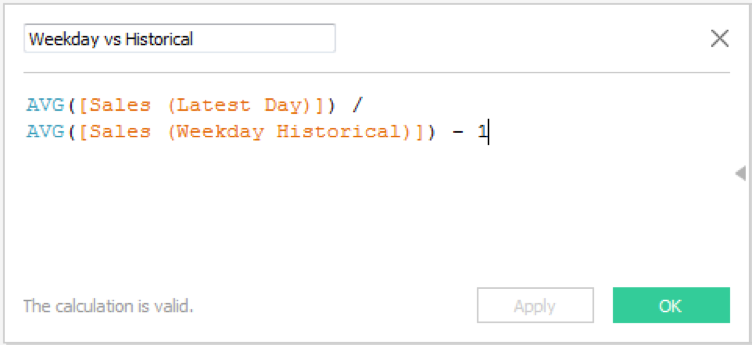
This formula computes the variance, as a percentage, between the average sales value on our most recent date and the historical average sales value for that weekday.
Step 5: Use the Output
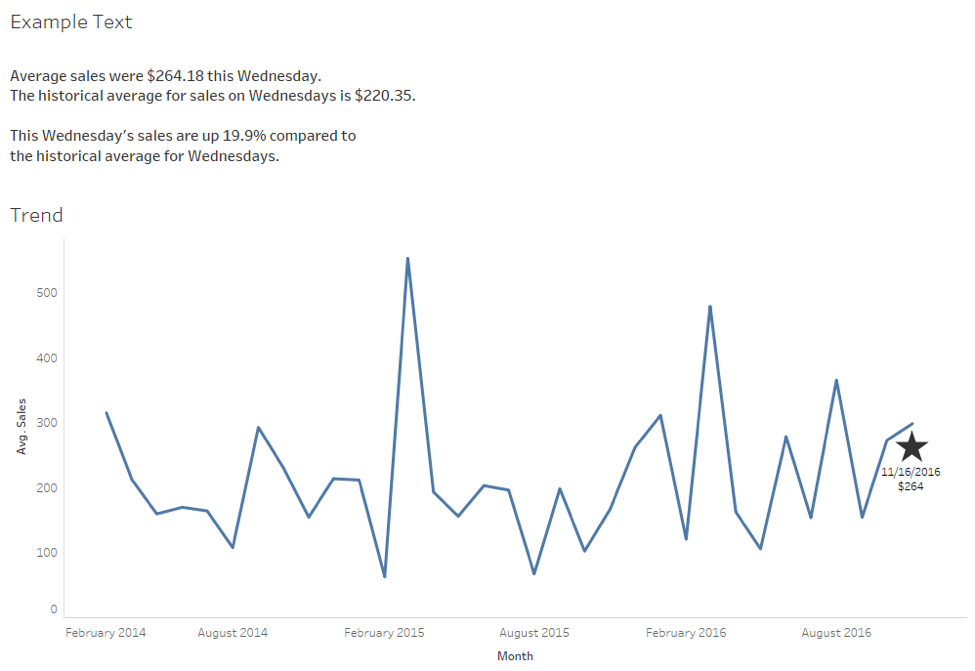
This proof of concept demonstrates how the results can begin to be interpreted. If you have any further questions, leave your comments below!

