If anyone ever told you it’s not possible to make a dynamic fiscal calendar in Tableau, then you weren’t talking to someone from InterWorks. It may require a few steps, but as is often the case, all we need are a few clever calculations.
So, what exactly do I mean by a “dynamic” fiscal calendar? Many clients I work with have come to me with the desire to analyze their data over time, with one caveat: their fiscal months don’t necessarily mirror those of the calendar year. A common standard I have seen is that their fiscal month starts on the first Sunday of any given month. For example, look at 2016: January’s first Sunday landed on January 3. That would mean that January 1 and January 2 should be treated as “December” data points for the previous year. Alternatively, February’s first Sunday was February 6. That means that February 1-5 should be treated as “January” data points.
There are many ways to approach solving this, but many methods I have seen are incomplete or only temporary solutions. Below you will find a more complete solution in which we build a new date field that can be re-shaped and manipulated like any other date field in Tableau. This date field also carries the benefit of having dates dynamically classified according to your fiscal calendar structure.
Step 1: Determine the Beginning of the Week
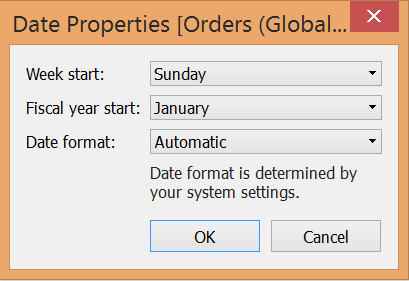
To get started, we first need to select the weekday that indicates the beginning of the week. You can right-click on your data source in the Data pane and select Date Properties… to open the settings shown below. Change these settings to fit your desired specifications:
Step 2: Build the Calculations
Now that we have the correct setting for the start of the week, we will build the necessary calculations to bring this dynamic fiscal calendar to life. Below is a table that illustrates how these calculations end up re-classifying the dates. Notice how for any given month the first week is designated as the first seven days following the first Sunday of that month. Any days of the month that land before the first Sunday are stored as data points for the previous month.
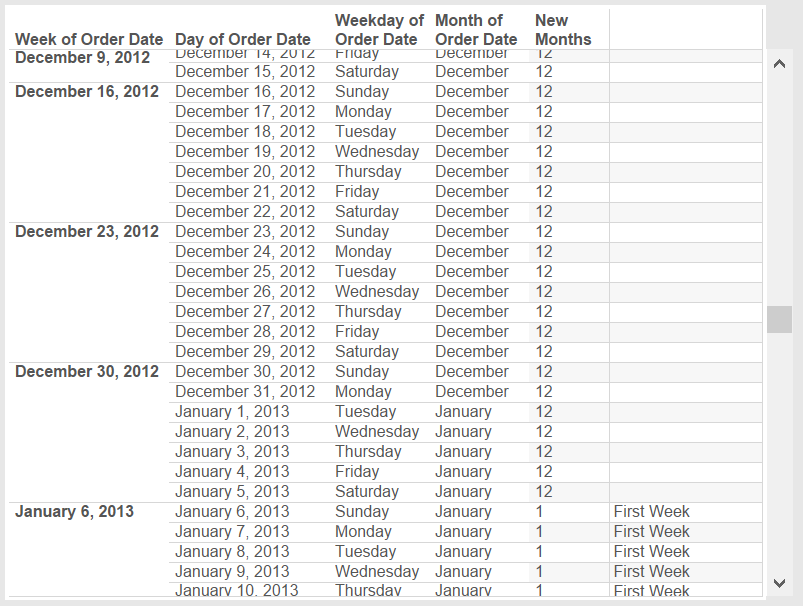
In the above image, New Months is a field that represents our new fiscal calendar months. Our next step will get us closer to achieving that end result. Creating the dynamic fiscal calendar requires us to identify the first full week of any given month. The following calculation accomplishes this:
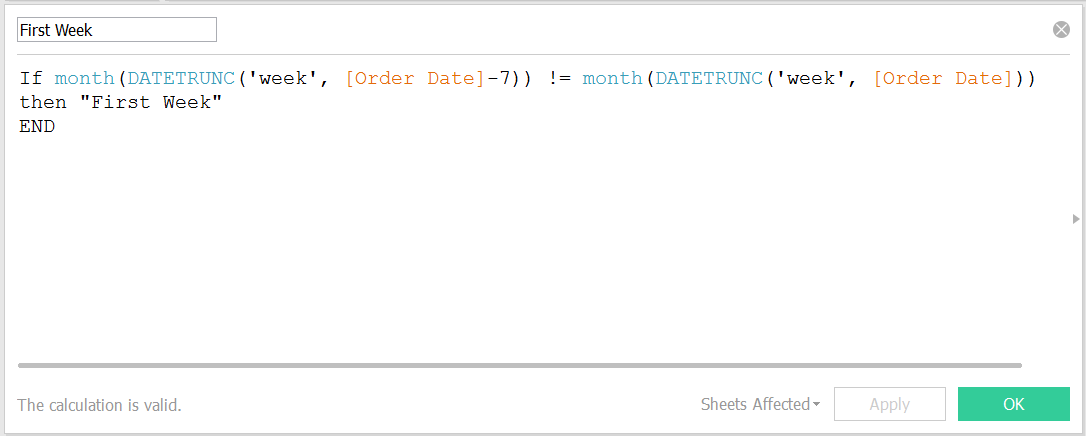
Now that we have tagged the first week of any given fiscal month, we can start to identify which days of the calendar month need to be re-classified as belonging to the previous month in our fiscal calendar. The calculation below does this for us:
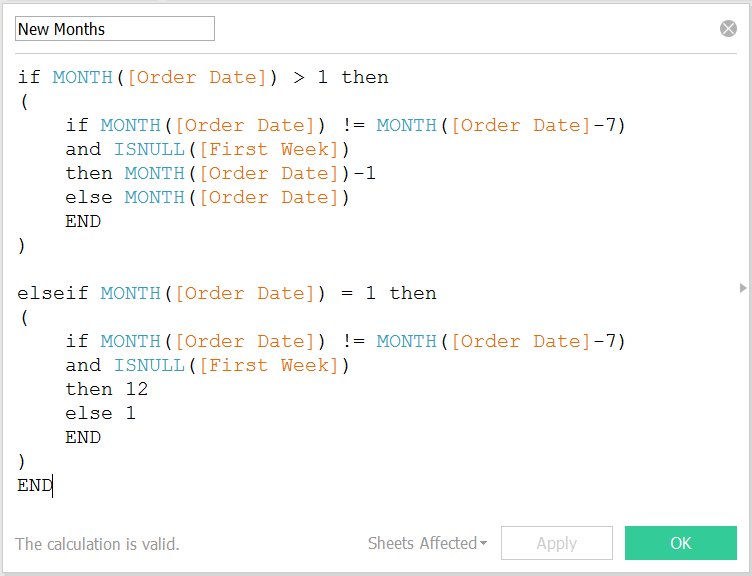
There are two portions of this calculation: one for January and one for all the other months. Why do we treat January differently? Because numerically, January is stored as the number “1.” So, if January’s first few days need to be classified as belonging to December, then we do not want our output to say we are in month “0.” We would instead want this month to be classified as “12.”
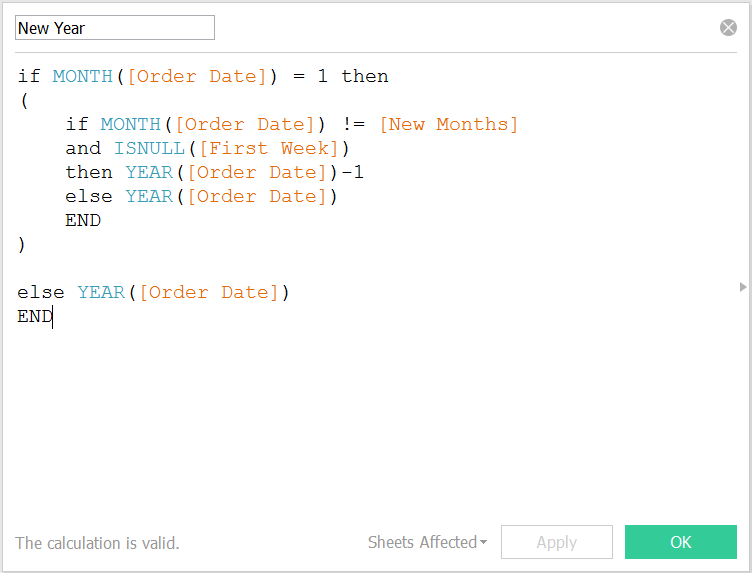
Now that we have the months covered, let’s look at how to handle the years. If some of January’s days are re-classified as belonging to December of the previous year, we need to alter the year value associated with those days. If we are studying any month that is NOT January, then the year will stay the same because the previous month will never occur in a different year. See the calculation below:
Step 3: Piece It All Together
Now that we have identified our new fiscal months and fiscal year, we need to piece them together. This is easily achieved through the use of Tableau’s handy MAKEDATE function. It allows us to glue together numerical values for year, month and day, thus creating one unified date field.

The advantage of creating this date is that you have full control over how time is represented in your charts. Your fiscal date can now show data broken down by year, quarter, month or week. The only option I would not recommend is analyzing day-to-day data. Why is this not a good idea? Let’s say the days of February 1-5 were re-classified as belonging to January. You may now technically have duplicate days of the month; for example, the REAL January 1 value as well as February 1 might both show up as January 1. In other words, you are not necessarily seeing the correct data on the day-to-day level. However, the year, quarter, month and week data will work perfectly as expected.
Here is a look at the before and after picture using a sample data set:
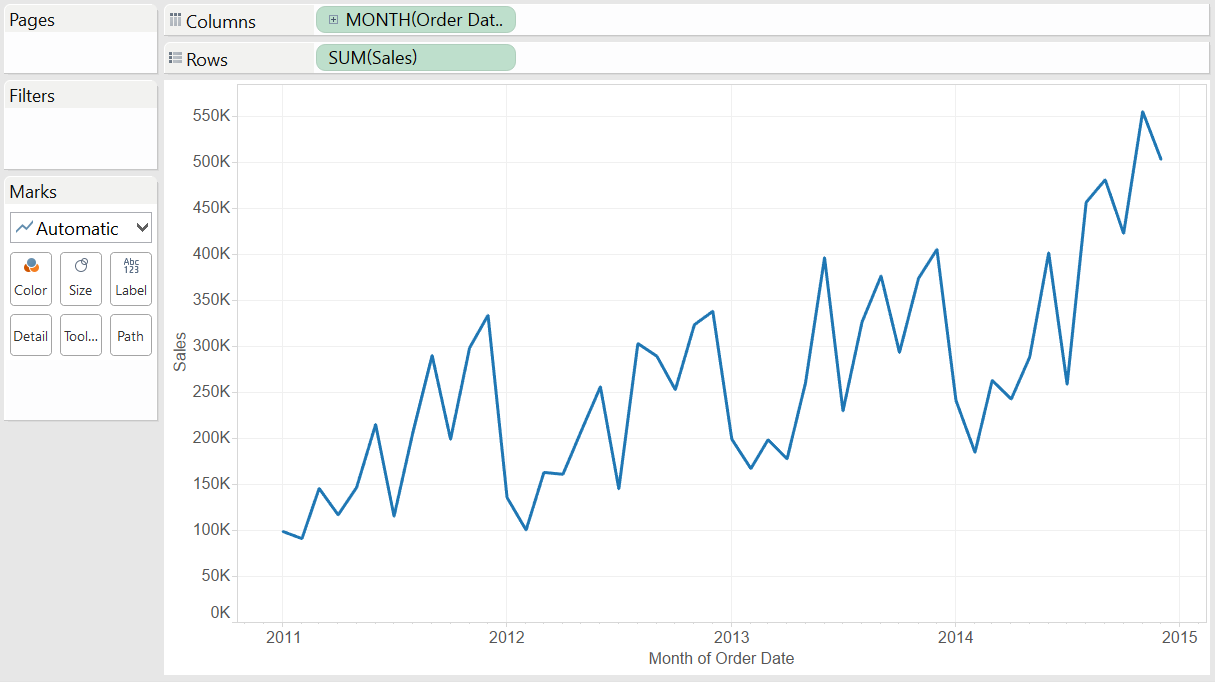
The picture above shows the standard calendar date. Below is the updated dynamic fiscal calendar:
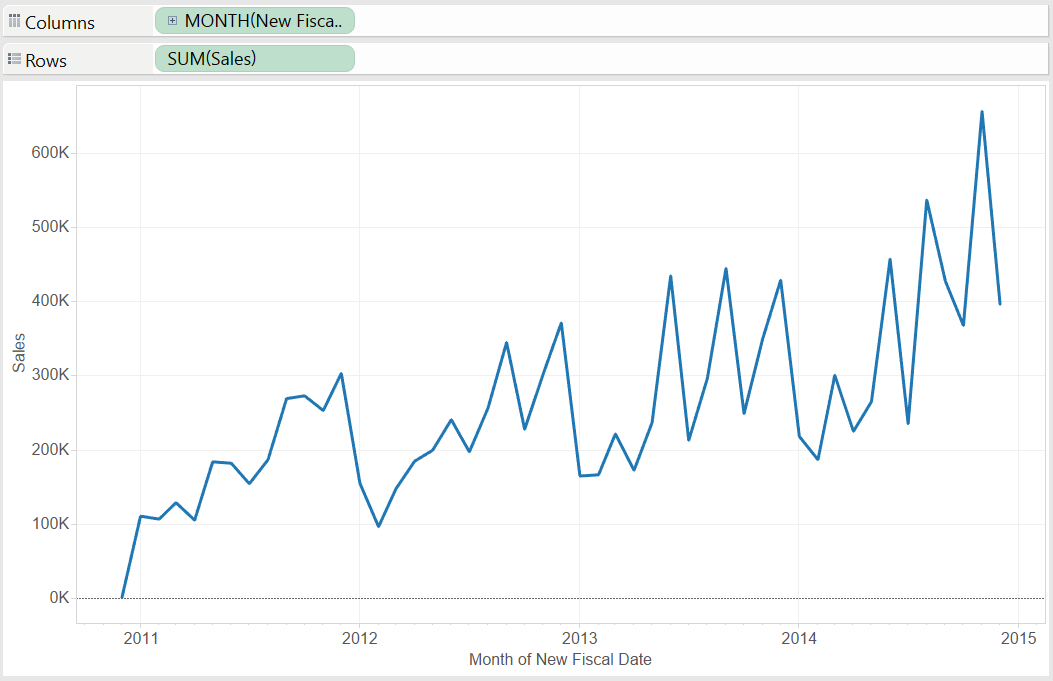
Now you can analyze your data over time without the hassle of manually calculating the start and end points of each fiscal month! The calculations listed above will always be dynamic, so you never have to worry about creating them again – even if your underlying data is updated.

