Question: How would I go about calculating how many states generate a specific percentage range of sales? Like > 10% of total sales as an example? I want to know where to target more marketing efforts. Can you help me get started?
As with most things Tableau, there are a variety of ways someone could approach this question: a combination of calculations, building a view then using table calculations, etc. I like the approach of writing multiple calculations because it simplifies my process. Both options can work, but the former is my preference.
What Is Needed
We need three pieces of information to build the view this client was after. I will use Sample Superstore data if you want to duplicate this in your Tableau workbook:
- Total Sales
- State Percentage of Total Sales
- The Distribution Logic desired
Total Sales
For this calculation, I decided to use a FIXED level-of-detail calculation (LOD for short). It looks like this:

State Percentage of Total Sales
Again, I will be using a FIXED LOD for this calculation but this time with the addition of the State to pull in each State level to the calc:

The Distribution Logic
For this calculation, we only need to determine the final distribution logic we want for our Tableau report. The question posed mentioned >10%, so let’s build that out.
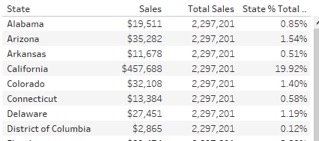
For reference, so far, our Tableau report could look something like this with these calculations added to a sales report:


You could add additional logic with ELSEIF if you needed to group more than two ranges.
My final report now gives me the states that I was after for the distribution questions:


