Super Bowl XLIX is almost here. In just a few days, the New England Patriots will take on the Seattle Seahawks in Glendale, AZ. Will the Seahawks win their second Super Bowl in a row, which would also be their second Super Bowl victory ever, or will the Patriots win their fourth Super Bowl in the Tom Brady era (since 2000)? Even better questions are will the Patriots deflate any more footballs, and will Seattle fans stick around for an entire game?
Only teasing. 🙂
As a Dallas Cowboys fan myself, I don’t have a horse in this race, which gave me an idea. What if I created a simple comparison between this year’s Super Bowl teams without any of the bias that come with being a fan of those teams? That’s exactly what I did, and I used Tableau to do it.
The Viz
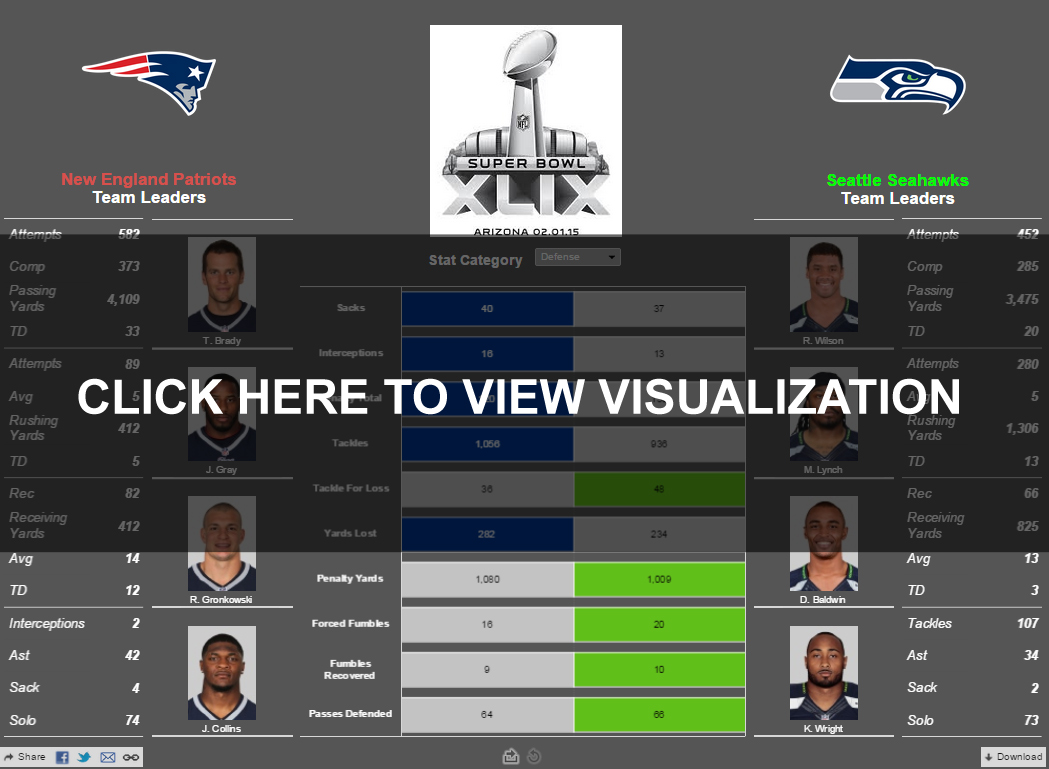
I kept this data viz simple and let the stats speak for themselves. Sometimes, simple is better. In the viz, you’ll see a head-to-head comparison of both teams in all major statistical categories. The winning team of each category is highlighted. Also included in the viz are the stat leaders for each major category – minus special teams. I think this viz is an easy way to compare key stats between each team without having to navigate back and forth between team pages on ESPN’s website.
The stats are interesting for a few reasons. First, there’s a common perception from Seattle fans that their “Legion of Boom” is on some sort of defensive pedestal, far and away better than other defense in the league. The actual numbers between their defense and the Patriots’ defense paint a slightly different picture. There are some other interesting comparisons, like rushing vs. passing and so on.
One thing is for sure, all of this will make for an interesting match up. Again, the viz isn’t the fanciest, but it gets the job done by showing side-by-side stats in a way that you can quickly understand. It also took no time at all to build. Enjoy!
Click on the image below to interact with the viz:
Note: The data used in this viz comes from ESPN.


