
In this series, Tableau Zen Master Dan Murray takes a closer look at the Tableau Prep Builder and Conductor tools, their power and scope and how they stack up against other ETL tools.
Before you begin building a workflow using Tableau Prep, it’s helpful to know a little bit about the data source(s) you need to connect to. Consider the following:
- What kind of source are you connecting to?
- How large are the files? Record counts? Rows/columns?
- Are you familiar with the data structures?
- Do you know of any data quality issues?
- How frequently will you be updating the data?
Understanding the Basics of Your Data Sources
Understanding the basic data structure and size, as well as the granularity of different sources, helps you plan the flow in your mind before you get into the detailed challenges that the transformation of the raw data sources poses.
In the example I’m drawing upon for this series, I’m using a version of Superstore data I created, along with public data from the Census Bureau. I’m going to create a workflow that will combine four tables containing annual sales data and a single dimension table that will be joined to provide regional manager names. These will be joined with a population dataset from the Census, enabling us to normalize sales for population for each state that had sales.
Connecting to the Sales Data
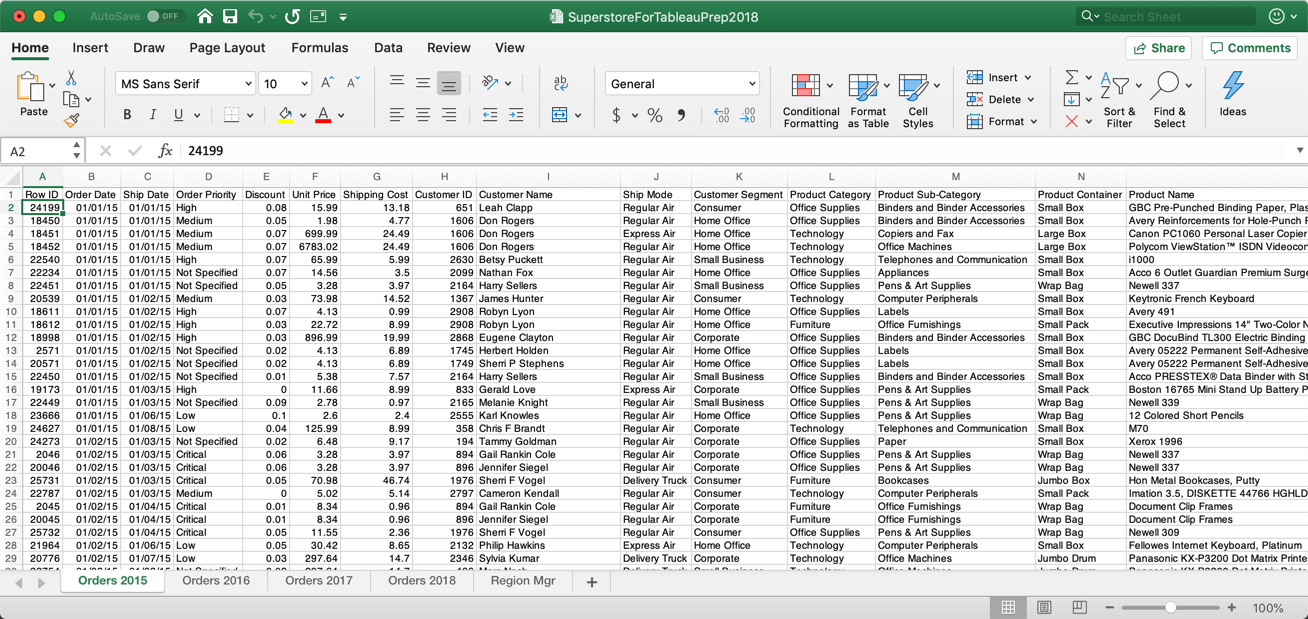
The data used in this example comes from two different spreadsheets: one that contains four (4) sales worksheets and one (1) Regional Manager worksheet, and another spreadsheet containing the census data.
Experienced Tableau Desktop users should be familiar with the Superstore dataset. In this spreadsheet, I’ve separated each year’s sale into its own worksheet. This data could have been in a text file or a database:
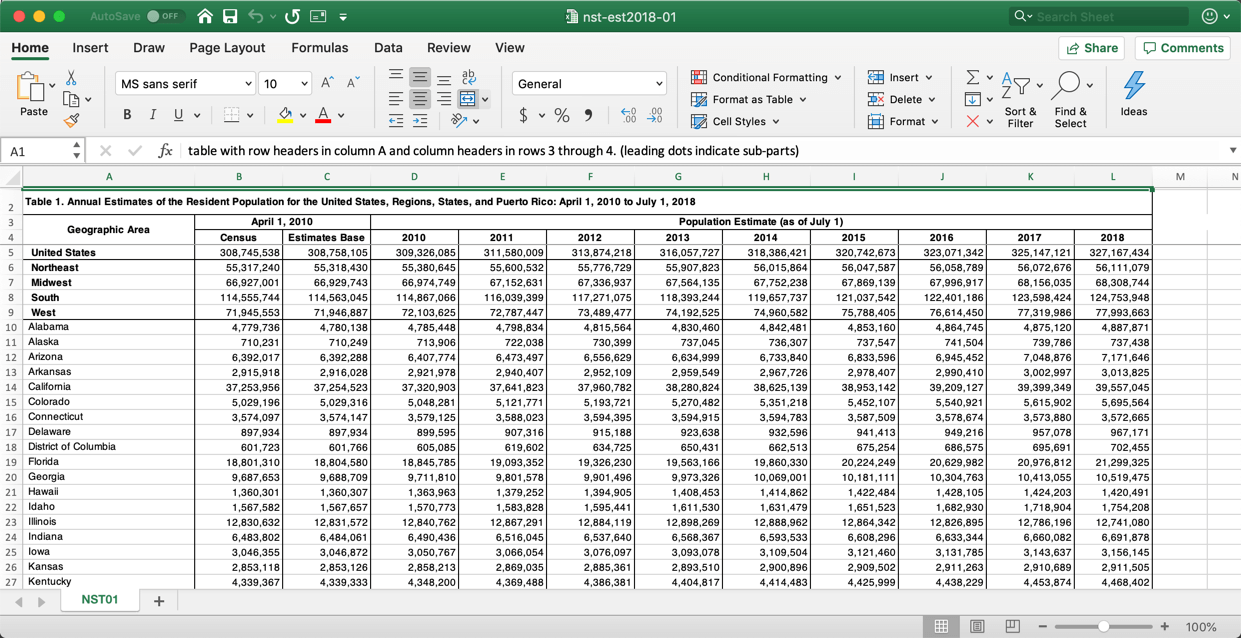
The Census data provides population estimates for each state for corresponding years:
Because the world isn’t perfect, we will have to deal with data quality issues in these files, different aggregations of the data, union different files, join files, pivot the data and re-aggregate the data. There are also inconsistencies within specific fields that will have to be cleaned. The datasets are small, but every kind of data transformation step that Tableau Prep provides will have to be utilized to prepare the data for analysis in Tableau Desktop. We will also create a calculation in Prep to normalize sales by state and year for the population in each state.
That data is not perfectly clean, and some of the structures aren’t right. That’s the real world. We’ll use Tableau Prep to address all of the issues and create a clean dataset for other people to use.
Connecting to the Superstore Sales Data
In this first video, you’ll see how to make a data connection to an initial data source and then add other files to that data source. We’ll make the following connections:
- Connect to the four sales tables
- Demonstrate a wildcard union
- Demonstrate a manual union
Using the Wildcard Union in Tableau Prep
Wildcard unions offer an efficient way to bring together many different tables with similar naming conventions that also have consistent column and row structures. If you’re working with unfamiliar datasets that may have data inconsistencies, I believe creating a union manually gives you more direct control and may make it easier for you to deal with data quality issues that emerge as you join each table.
Using the Manual Union in Tableau Prep
I like using manual unions when I’m working with a new dataset because it’s easier to identify mismatched field-naming conventions. The inconsistent field names (Sales vs. Revenue) didn’t appear until I brought in the 2018 sales data. The visual cues that Tableau Prep provided, and the filtering in the data grid for mismatched fields, made it very easy to find and merge two different fields that were actually both holding sales data.
It was also easy to make minor changes using the Profile Cards for specific fields. I used that to remove the Table Names field, which Builder adds automatically when you union data. I don’t want to see that information in my output from this workflow, so I removed it. In addition, because Row ID is a number, Builder treated it as a number in the profile pane and generated a histogram in that field’s profile card. I wanted to validate that the Row ID field is a unique key for this dataset, so I changed the field to a string, and the profile card was changed in a way that made it easy to see every Row ID is, in fact, a single row of the data.
In the next post in this series, I’ll show you how to add a cleaning step to make additional modifications to fields.