
In this series, Tableau Zen Master Dan Murray takes a closer look at the Tableau Prep Builder and Conductor tools, their power and scope and how they stack up against other ETL tools.
Tableau Prep Builder and Conductor are Tableau’s tools for enabling repeatable, documented and scheduled workflows to transform raw data into user-friendly datasets. Tableau Prep Builder’s first live release came in April 2018 in Desktop 2018.1, and since then, we’ve had four major releases and eight minor updates. Over the past year, Tableau has expanded the Builder feature set substantially.
Tableau Conductor is the server complement to Builder that provides the framework and tools for publishing Builder workflows and datasets to Tableau Server. Tableau Server’s Data Management Add-on released in V2019.1 in February 2019 and enables you to automatically refresh published workflows.
What This Series Will Cover
In this blog series, I’ll be covering the Desktop environment of Prep Builder and all of the related data-transformation tools that are currently provided. I’ll also discuss the basics of installing and managing workflows using the data management add-on toolset for Tableau Server and will complete this series by providing a comparison of Tableau Prep and Conductor to other ETL tools available in the marketplace.
If you are already familiar with the Data Interpreter in Tableau Desktop, your learning curve for Tableau Prep will be short. I’ve kept an eye on Tableau Prep ever since its release, but I haven’t bothered to do a deep dive with the tool until this year (though some of consultants have recognized that Tableau Prep is truly a game-changer). Over the past month, I’ve spent a lot of time playing with Prep and publishing workflows to Tableau Server to see exactly what Tableau is offering now.
Per usual with Tableau, when a new set of features is good enough, they release something new. Over time, Tableau adds more features. Generally, the features added come from a combination of their internal product roadmap and external feedback from the user community. Tableau Prep has now matured to a level where the feature set is equivalent to the Data Interpreter in Tableau Desktop, but it adds the automation and repeatability of a real extract, transform and load tool.
Tableau Prep Work View and Start Page
I’m excited about the possibilities of Tableau Prep and Conductor. While I wouldn’t call this an enterprise-class ETL toolset, Tableau brilliance at user interface is evident. I love the way that Tableau has implemented the transformation features. It’s very “Tableau-like.” Tableau continues to live their mission of making it fast and easy for you to see and understand your data. Here’s a Tableau Prep workflow that I created earlier today:
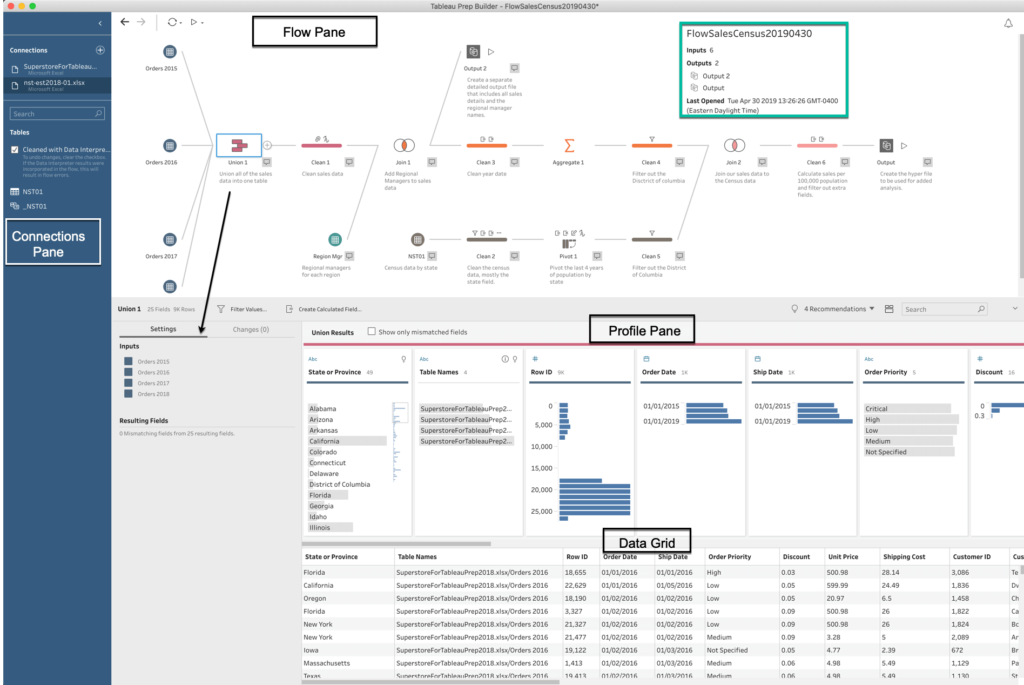
There are four areas in every workflow:
- The Connection Pane
- The Flow Pane
- The Profile Pane
- The Data Grid
The arrow pointing from the Union 1 step to the Settings area displays a flexible screen space that will change depending on what specific step you click on in the workflow.
In typical Tableau fashion, every icon has a specific meaning. Tableau automatically assigns different colors to each step. I’ve altered some of the colors to my taste and to better reflect common sources (see how the Orders 2015 – Orders 2018 are the same color). Notice that I’ve added customized descriptions next to each step in the workflow. Tableau Prep also allows you to change the system-assigned names for each step within the flow, which are displayed below each step heading.
In addition, I pasted some summary information from the Start page in Builder:
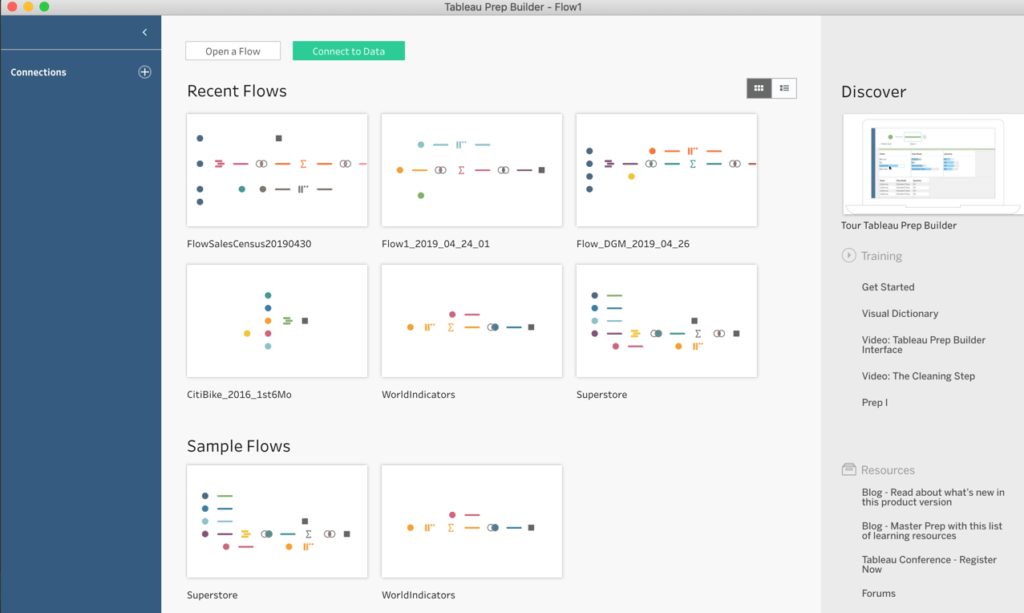
The Builder Start page is very similar to the Start Page in Tableau Desktop. Connections are accessed using the plus sign (+) on the left, available workflows are displayed in the center, and the Discover pane on the right supplies the same type of training videos and resources that you’ve become familiar with using Tableau Desktop. Hovering your mouse over existing flows causes summary information about the flow to display.
I appreciate Tableau’s design consistency between Desktop and Prep Builder. The interface behaves in a way that makes learning Prep Builder easy for any experienced Tableau Desktop user.
In the next post, we’ll demonstrate how you connect to one or more data sources, and we’ll review the different ways you can join and union those data sources.