
Please note that Portals for Tableau are now officially known as Curator by InterWorks. You can learn more at the official Curator website.
At InterWorks, we live and breathe Tableau. It is an awesome product that helps us to analyse data, draw insights and share them across all types of businesses and industries. Over the last few years, however, clients had been asking us for a public facing embedded analytics solution. Portals the platform was born!
What Are Portals for Tableau?
Portals for Tableau use Tableau Server functionality and licensing through a totally customisable web interface to present your dashboards in a secure and familiar way.
Tableau Server is great for people who have years of Tableau experience and attended trainings, but sometimes can be hard to use and navigate for people with little experience or senior management with limited time to play and learn.
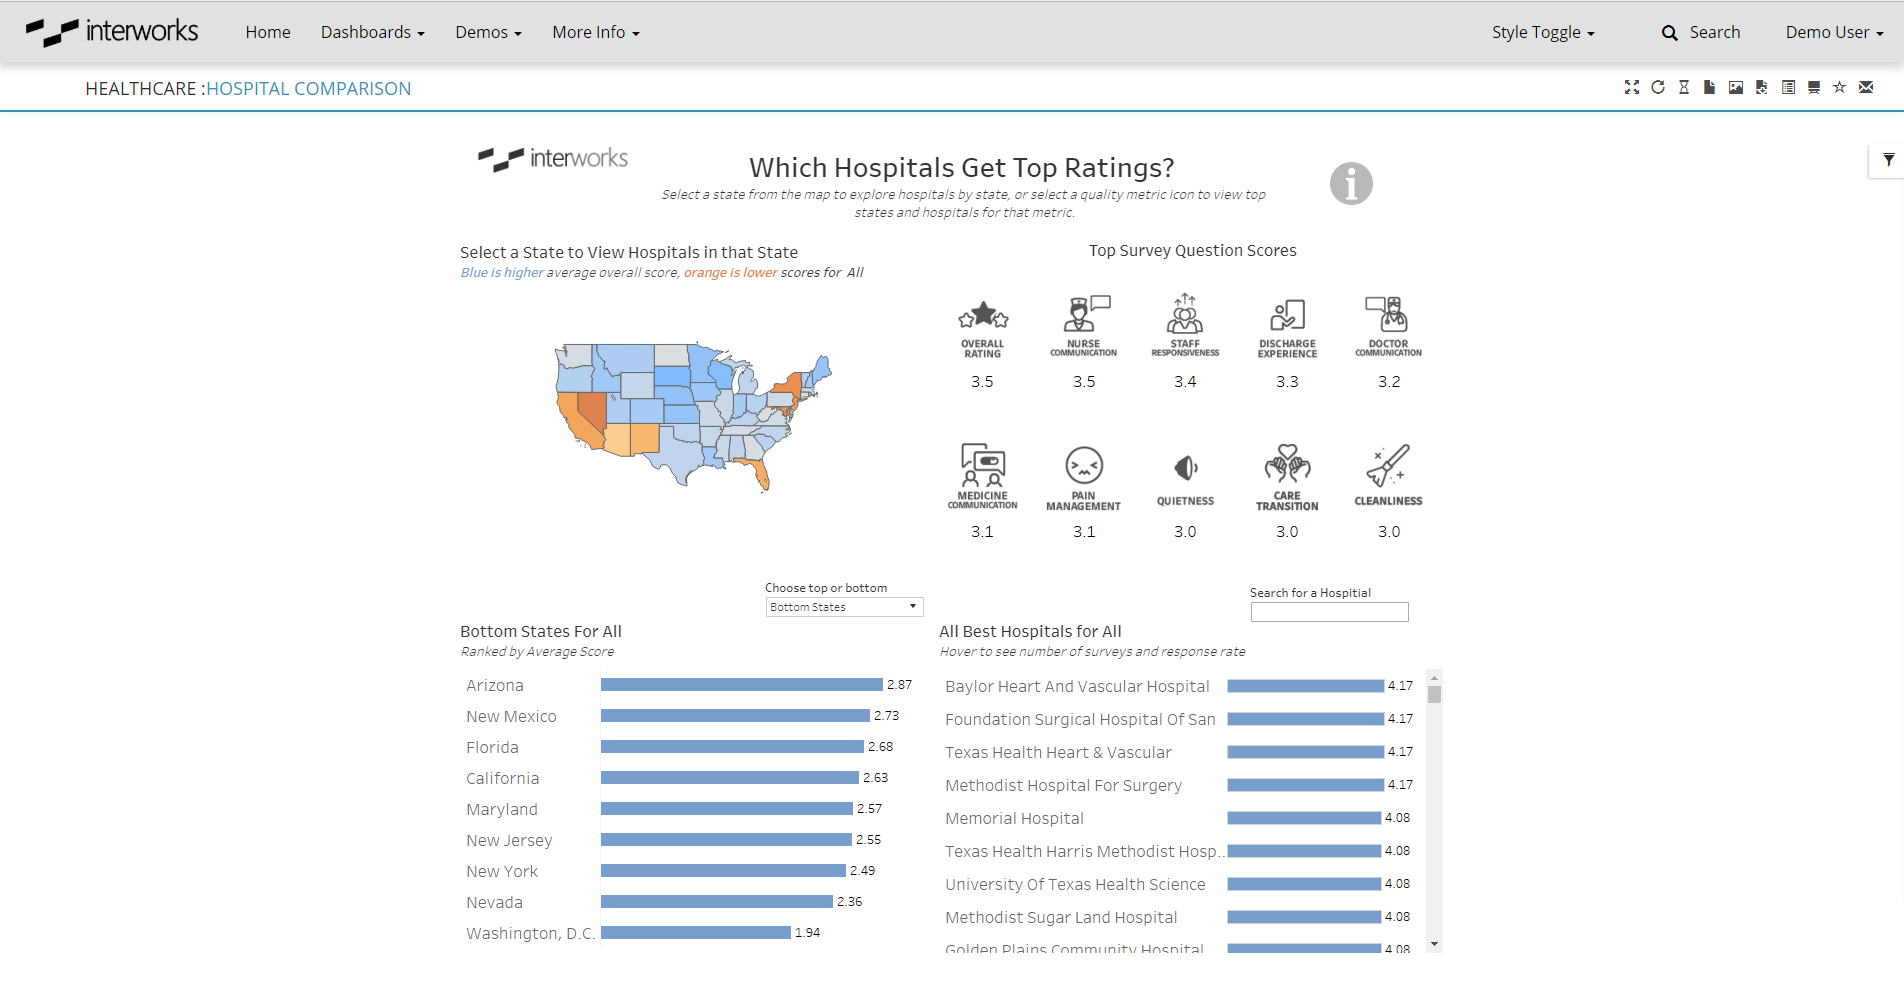
Above: An example Tableau dashboard embedded in a portal.
What Are Embedded Analytics?
In Portals, embedded analytics embed your interactive Tableau visualisations in a webpage, enabling users to access, filter and drill down easily.
Everything outside of the visualisation (colours, logos, navigation, etc.) is controlled by the website. The webpage can function differently to Tableau Server; in fact, you don’t even have to know it is Tableau! But rest assured, the visualisations will act the same as in Tableau as they are coming direct from the Server.
Why Use Portals?
- Easy to use – Portals have a clean and familiar “website” feel where no instructions are needed. It is simple and easy to find what you are looking for.
- Totally customisable – Anything can be customised: logos, colours, font and placement. You could decide to move your menu from the top to the side, you could insert a fun GIF, corporate video or text, add custom tabs or a custom loading screen.
- Consistent with brand guidelines – This reporting platform can have your company logo; your client doesn’t need to know that they are viewing visualisations built in Tableau.
- Favourite dashboards – Users can tailor their own Portals experience by using gold stars to favourite dashboards that might be of particular use and interest to them.
- Related content – There’s even an action to show content that is related to the dashboard the user is currently viewing. This can make it easier for users to dive deeper into the data.
- Search function – Users can search within dashboards on Portals, pages in Portals or external pages. This just needs to be set up using indexed keywords. Will your users still need to view legacy reports for a short time? You can help them to navigate towards those reports.
- Exportable – Easily export visualisations to PowerPoint or PDF using a template so that branding is consistent with other communications. Yes, Tableau dashboards were made to be interactive, but businesses still use printed reports, so InterWorks are responding to that common business request.
- Resetting filters – You can reset all filters at once taking you back to the starting visualisation.
- Dynamic parameters – One of the biggest ideas on the Tableau idea forum is dynamic parameter functions, meaning that if your data changes, the parameter values should too. Portals can do that.
- Pop-out menu – Save much-needed space on your dashboard by utilising the pop-out filter/parameter menu in Portals.
- Sticky filters – Filter and parameter selections can follow users around between different workbooks so they don’t have to repeatedly select the same series of options. A regional manager might not ever want to see other regions so this will help them to save time and focus their attention on their area of interest.
- Data refresh timers – Visualisations can be set to refresh regularly so that users can see the latest data, for example a TV wall screen in an office might show the latest call centre statistics refreshing every 30 seconds.
- Same great product – Fully interactive just like Server; use highlight, tooltips, select filters, etc.
- Security you can trust – Permissions from Tableau Server: No access to Server, then no access to Portals. User authentication is tied directly to Tableau Server, so any user on Server can log into Portals and their permissions are transferred.
See Portals for Yourself
There are entirely too many wonderful Portals features to list in one blog post. I recommend taking a look at the live Portals demo to see for yourself what they can do. Of course, we’re always rolling out new features with regularity, so keep an eye out for those.
