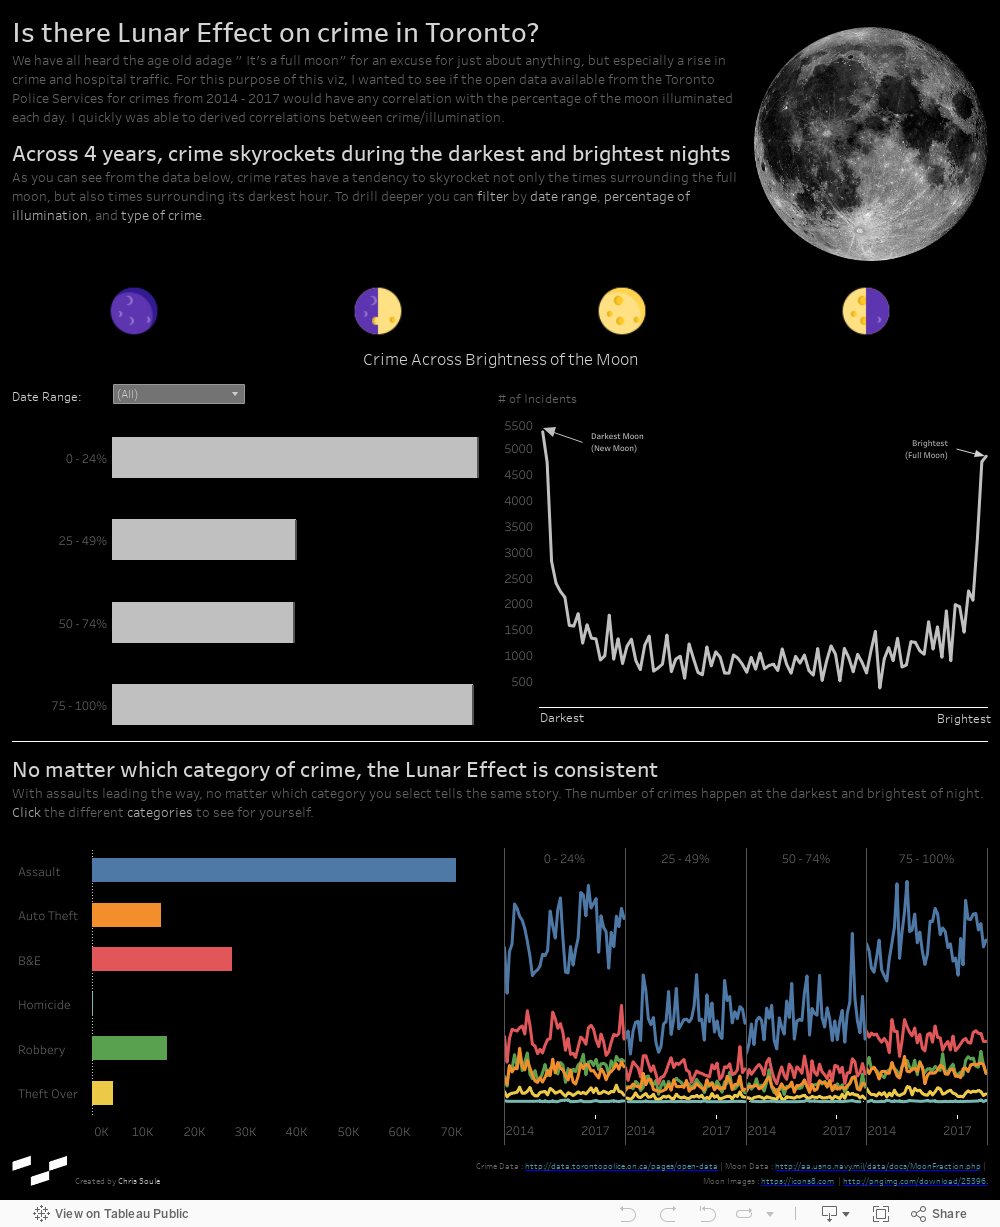
It all started when I wanted to make a dashboard on the correlation between the brightness of the moon and crime activity. It’s one of those things everyone has heard in their life whenever crime or hospitalizations spike (or at least I have): “It must be a full moon.” Being an IT nerd at heart, naturally I was interested in what the data had to say.
Pulling in Data Sources
In search of open data to use, I stumbled upon some for Toronto Major Crime Indicators (MCI) that referenced the number of events spanning four years. But for some reason, the site had homicide events in a dataset all their own, so I knew I would need to join that data to the other somehow. I also wanted to bring in data relevant to the moon for the same period, but the information I found contained the percentage of moon illumination in a dataset apart from the actual dates of the moon phase. To complicate things further, the phase information did not contain every single date in the dataset, so if I just simply joined these two, I would have a lot of blank fields.
Scrub-a-Dub, Data in the Alteryx Tub
I had my datasets, but I needed a way to bring them all together. Enter Alteryx. Alteryx makes this process a breeze through its easy drag-and-drop interface and pre-built blocks of code. Although Alteryx has advanced data analysis capabilities for things like prediction and pattern recognition, I decided to use just the ETL capabilities for this project and do more of a manual exploratory analysis with Tableau. I’ll save the advanced stuff for another post.
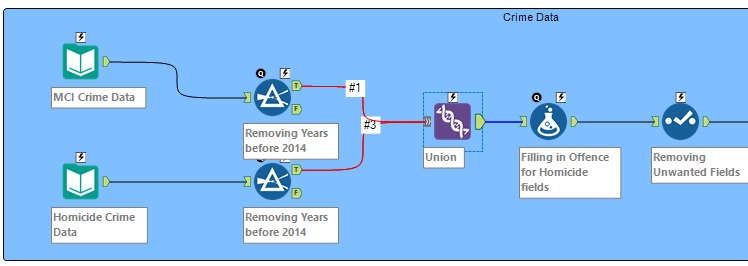
Upon inspecting the crime data I found, I noticed that the occurrence date field did not necessarily align with the reported date field. It even appeared to have older occurrences in both datasets that were reported in 2014 but had actually occurred years earlier. Since I was more interested in when crimes happened during the four-year period, I knew I would need to filter out the older dates. I grabbed Alteryx’s easy-to-use filter tool and quickly removed all data with an occurrence year older than 2014 in both the homicide and MCI datasets. Then I needed to bring both datasets together.
Bringing the Data Together
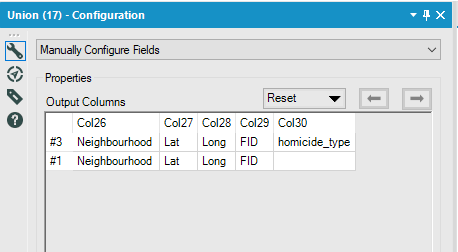
Since I didn’t want to add additional information to any of the existing rows in either dataset but rather add additional records to the list, I utilized the Union tool instead of the Join tool and instructed Alteryx which columns should go where. This was comprised in a simple stacked-field configuration where I could match similar fields and create new ones if the columns matched across the datasets.
At this juncture, it’s worth noting that I used the Browse tool each step of the way to have more insight on what was happening to the data as it was being modified, thus ensuring data quality. Plus, it could point out things, like the fact that one of the main fields was no longer 100% populated in my new dataset. This made sense because the entire homicide dataset was one category of its own and didn’t need to have an offence category. Before the union, I used the Browse tool again to verify that the other dataset had 100% of the offence field populated and then dropped in a Formula tool to my flow to replace all nulls with the word “homicide.”
Now that I had both crime datasets combined, it was time to remove some of the unwanted columns I didn’t need for what I was comparing. I slimmed them down using the Select tool. This tool gives you the option to remove selected fields and even re-order the fields. I believed I had my crime data where I wanted it:
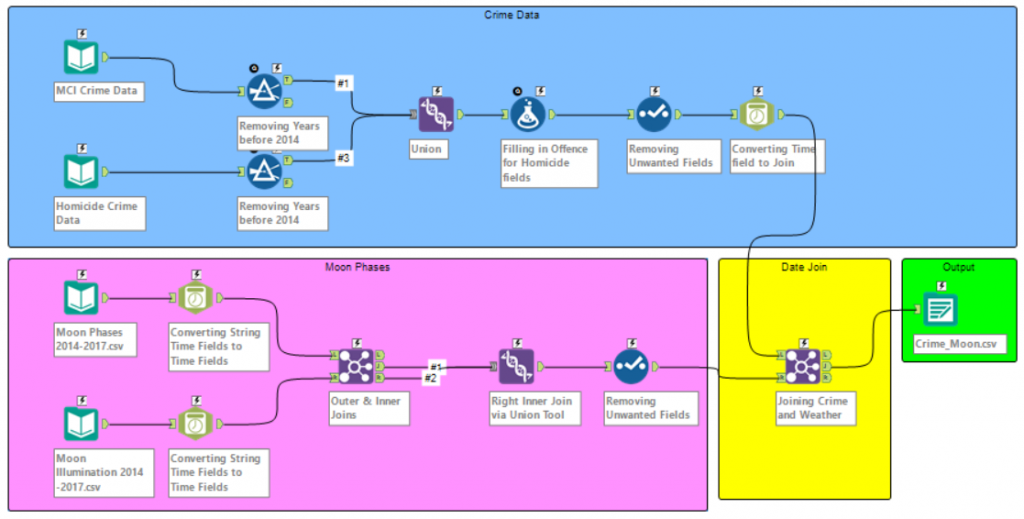
Now to prepare the moon information. Since the date fields in both datasets were formatted as a string, I used the DateTime tool to convert them to a true datetime field first. I again had separate datasets that I needed to combine. Combining the datasets this time around was going to be a little more complicated since I only had specific dates for the exact moon phases and all the dates for four years in the other. Since I wanted to keep all the records in my (right) illumination dataset and just add information to each of the rows from my moon phase set, I could simply perform a right inner join.
The Join tool in Alteryx only performs three types of joins. It can perform left and right outer joins, which is the data in each set that can’t be joined to the other, or an inner join, where you only get the records that could be joined. By combining the Join tool with the Union tool, you can simulate left and right inner joins, as well as a full join. In this case, I needed a right inner join, so I used the Join tool to join both sets on my new date field. Then I used the Union tool with the inner join output and the right outer join output.
All Clean! Time to Meet Tableau Under the Moon
Now I was finally ready to simply join my crime and moon data on my date field and serve it up to Tableau for some exploring.
Prepping the data using Alteryx enabled me to quickly take in multiple datasets and transform them into one file I could quickly query from without using a bit of coding. The result was a cool dashboard in Tableau that suggested a darker and brighter moon does correlate with crime, no matter what kind. Alteryx let me just focus on the story I was telling instead of forcing Tableau to do something it wasn’t meant to do. Although this is just scratching the surface of what Alteryx can do, I hope it helped shine some light on at least the ETL portion of this Swiss army knife.
If you’re interested in the Tableau portion of my project feel free to head over to my Tableau Public page where you can download the dashboard I made.