If you are not already familiar with cross joins, you may want to read through my first post in this series for another use case. In this article, I will further define and expand on cross joins.
What’s a Cross Join?
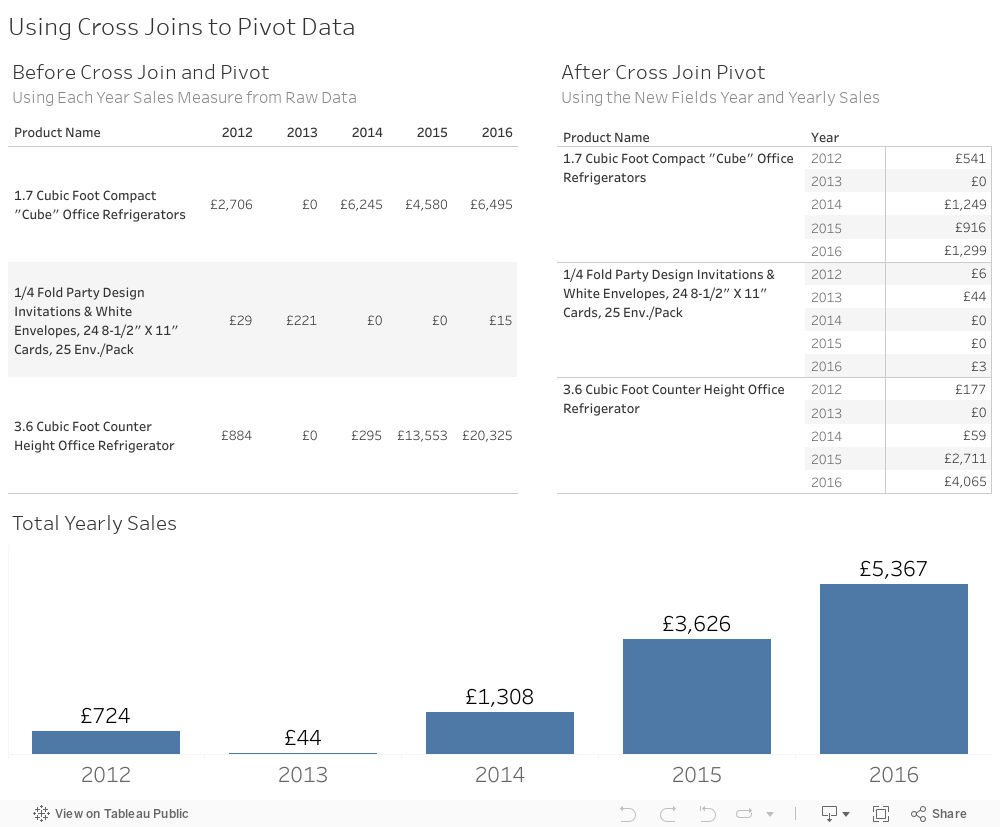
Sometimes we are stuck working with a non-normalised data source. Instead of a row-based structure, we end up having columns. Our end result tends to show years as their own columns instead of as rows. It can quickly become difficult to work with this in Tableau.
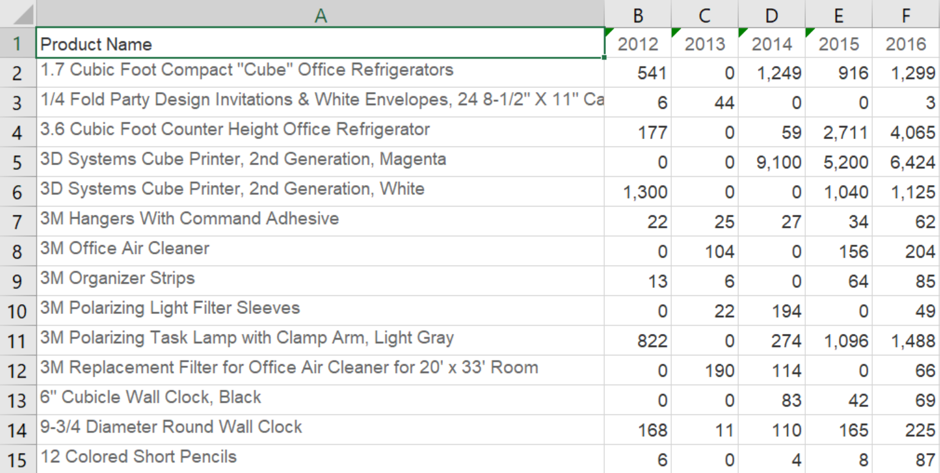
Tableau has the ability to move this data with the Pivot Helper option, but it only works on text and Excel files. We are also able to use custom SQL, but for some people writing custom SQL can be intimidating, not to mention bothersome if you have many columns. Another way to handle this is by coupling a data manipulation technique, called a cartesian product, with a few calculated fields.
Another name for a cartesian product is a cross join. In a cross join, every row from one table is joined to every row from the other table. Cross joins are not a native Tableau option, but we are able to implement it rather easily by utilising Tableau’s custom join calculations beginning in the 10.2 version.
Getting Started
In this example, we will have two data sets. Our raw data and our Pivot Helper data set. The Pivot Helper data set is a single column with the number of rows equal to the number of columns you wish to pivot. In our case, we have five or one row for each year column in our raw data set.
For sanity sake, I’ve placed these two data sources in the same Excel file, but they don’t necessarily have to be together! Thanks to cross database joins (not to be confused with cross joins), we can use this technique between databases. So your raw data could be coming from an Oracle DB and your Pivot Helper could be an Excel file on your desktop.
Drag the Easy Pivot sheet into view and drag it to the Pivot Helper as well. You’ll then select the add a new join clause option in the join view.
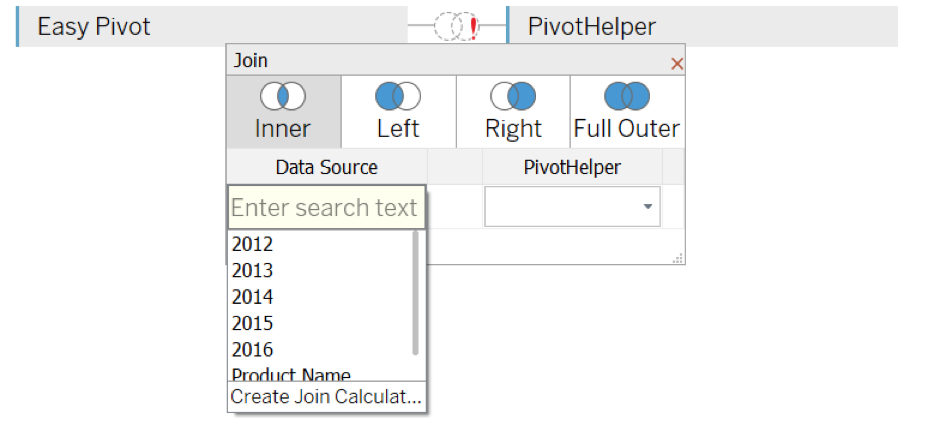
From here, create a Join Calculation. I like to use zero for my cross join key. You can use any number, but using an integer is best as they are the most performant. Now, do the same under the Pivot Helper.
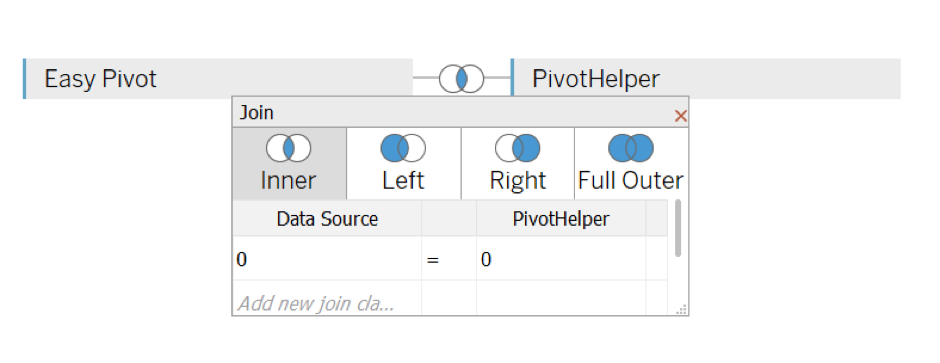
Even though this does not materialise in the data sources, you can imagine that there is a new column in both data sets. In every row, the entry is zero. When joining Easy Pivot to Pivot Helper on this new column, every single row from the Easy Pivot side will be duplicated for the five matches on the Pivot Helper. The only difference is they will be differentiated by the values one through five. We will use those differences to force the pivot, so to speak.
Go to the sheet next and we’ll begin making some calculations. There are two calculations we need.
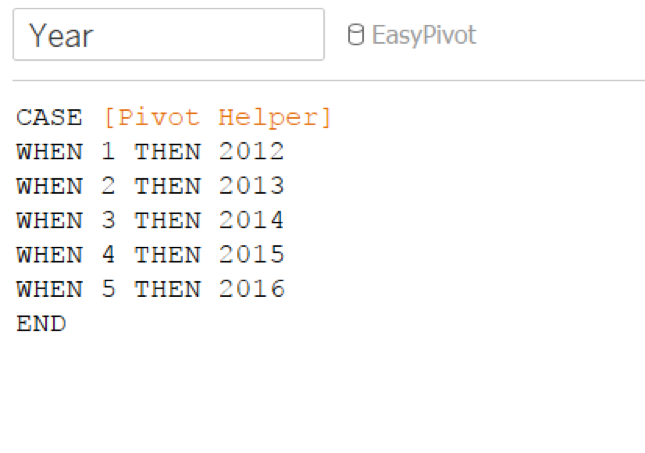
You need one to create a dimension (Year).
And the second is to create the measure (YearlySales).
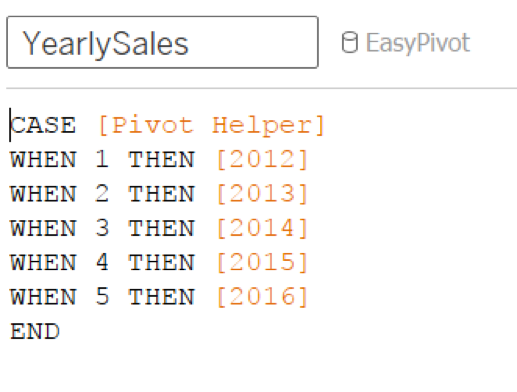
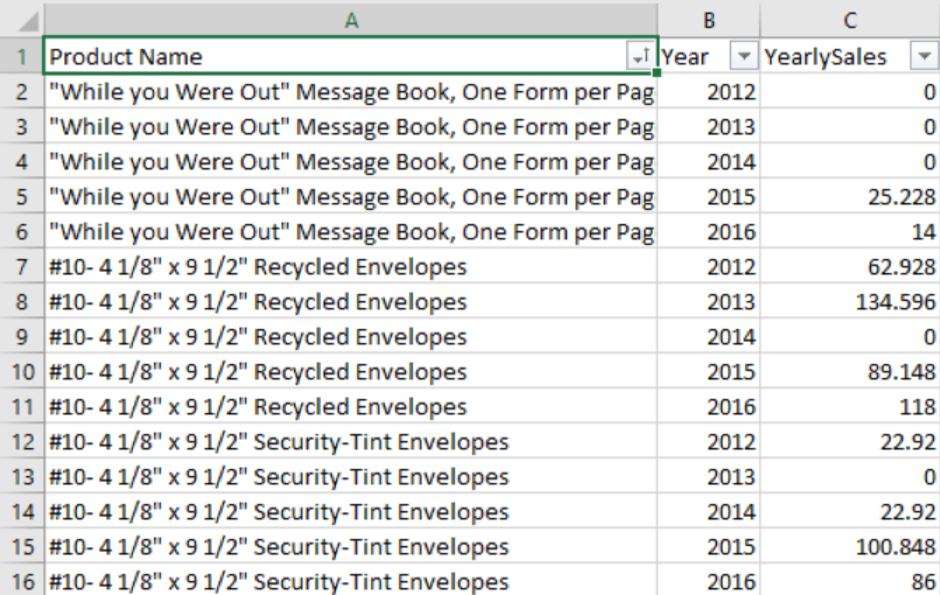
The [Year] case statement returns an integer, which we later treat as a dimension. In the [YearSales] statement, we should get our sales values per year. I’ll hide all the excess fields by placing them in an old fields folder. Now, you can treat these like any normalised data source where you have five rows per product name or one row per year. Your new raw data that you’re using in Tableau would look like the image below.
The MN/MV Option
We could have managed this in Tableau by using the Pivot Helper functionality or by using Measure Names and Measure Values. Pivots, however, can only be used on a few specific data types. MN/MV is a great option. With this data set it’s perfect, but you might have had a data set with multiple measures per year. You’d want to use MN/MV twice, essentially nesting them and this is not possible. With my example in this article, you’ll be able to cross join to pivot and then use MN/MV to split the separate measures by year.
With most data manipulations, its better if you can get your data in this format within your database of choice before Tableau gets involved. It will make your life much easier. You can see my final dashboard below and get in touch if you have any questions about cross joins!