
One of my favorite announcements at TC16 was the new ability for Tableau to natively read shapefiles. Shapefile (.SHP) is a data type used for storing maps. This feature totally revolutionizes the things we can accomplish with our maps inside of Tableau. For more information on using shapefiles in Tableau 10.2 refer to David’s blog here (link to blog).
But what about those of us who can’t immediately update to the newest version? I see it all the time in training – whether it’s due to company vetting processes or not having admin privileges on your laptop, not everyone can update immediately. What are they supposed to do?
Another Way with Alteryx
This method doesn’t apply to everyone, but if you have access to Alteryx, we could leverage the Alteryx Community and create a workflow to transform our shapefile into mapable coordinates!
The Tableau to Polygon converter by Craig Bloodworth is a great Analytic App that can take inputs from .SHP files, and output a data set that we can use to blend with our data and visualize custom geographic regions in Tableau.
In the example mention above, my friend wanted to view different neighborhoods in our nation’s capital. Traditionally, in any Tableau version prior to 10.2, we wouldn’t have been able to map these custom shapes. Let’s use the Analytic App and see what we can make happen. In this example, I’m going to a Neighborhood shapefile from Washington D.C. Open Data.
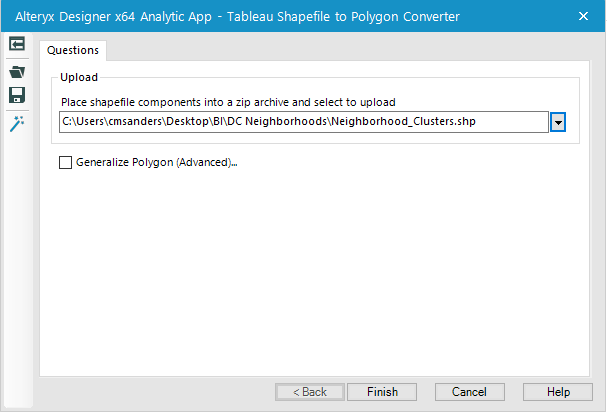
After running the app, you’ll have the option to open the output as either a .CSV or .TDE. For this case, I’m going to opt for the .TDE, but using a .CSV works just as well (and may even add some additional functionality for use in other tools).
Once we connect to our .TDE output, we’ll have to make a few changes to our fields. By default, Tableau will read the fields Point ID, Polygon ID and SubPolygon ID as measures. Let’s convert those to Dimensions, like this:
Now let’s map our neighborhoods!
First, double click Latitude and Longitude (Tableau should automatically bring Longitude to Columns and Latitude to Rows).
Next, let’s change our marks from Automatic to Polygon, bring our Polygon and SubPolygonID fields to Detail, and bring our Point ID field to Path.
We’re almost there, but just for fun, let’s also bring our Neighborhood Name field to Color to differentiate across different neighborhoods within the city.
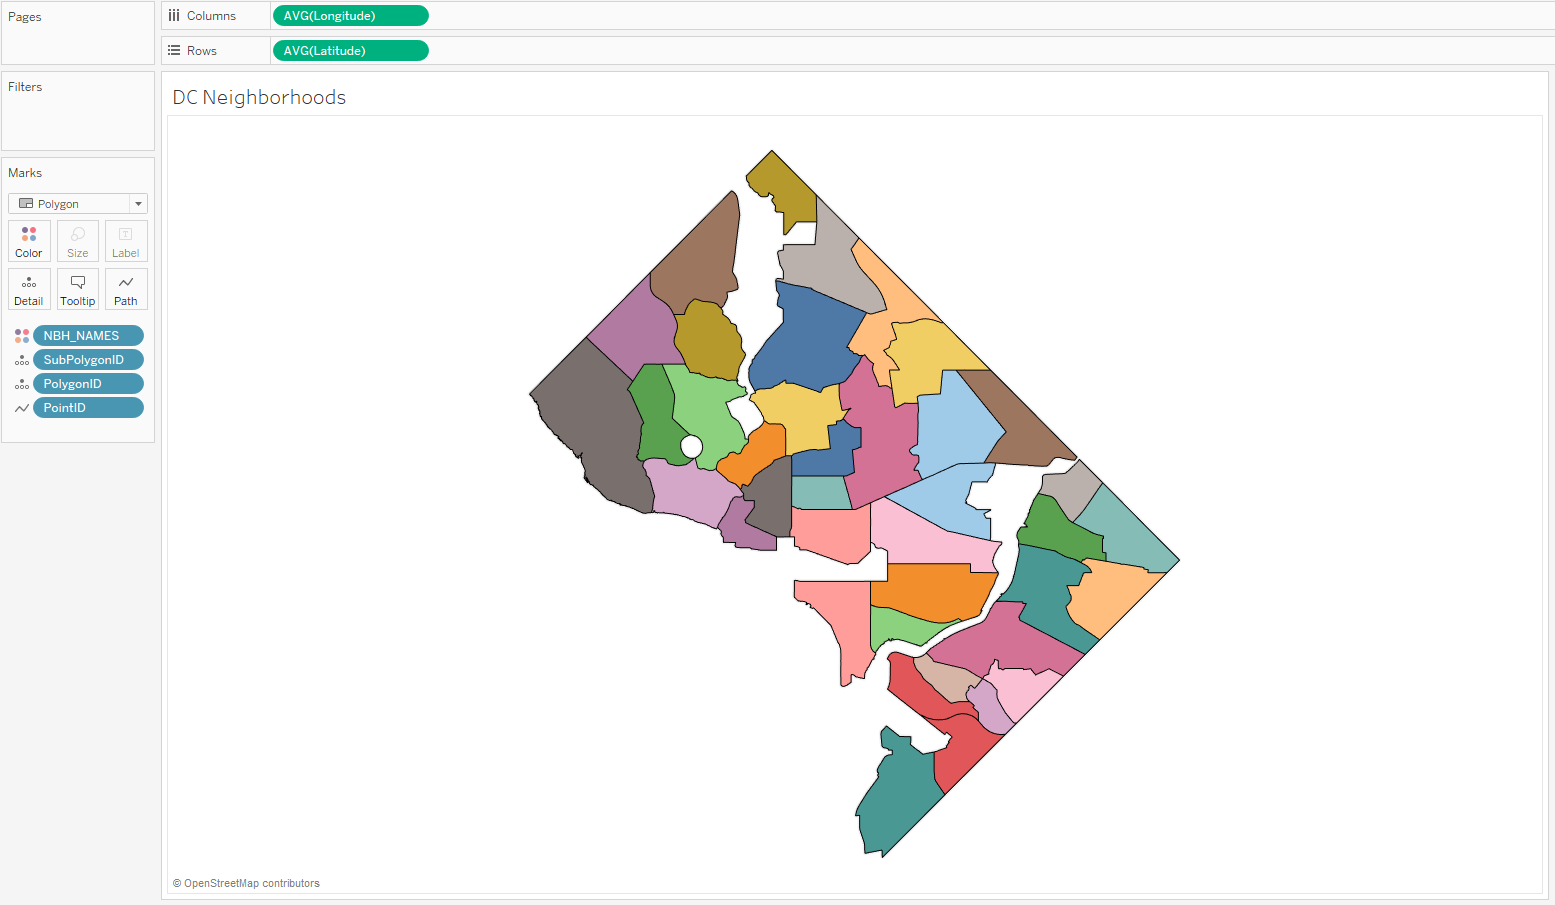
And there we have it – a map of our D.C. neighborhoods.